
Dear fellow,
Could you read the attached ecg
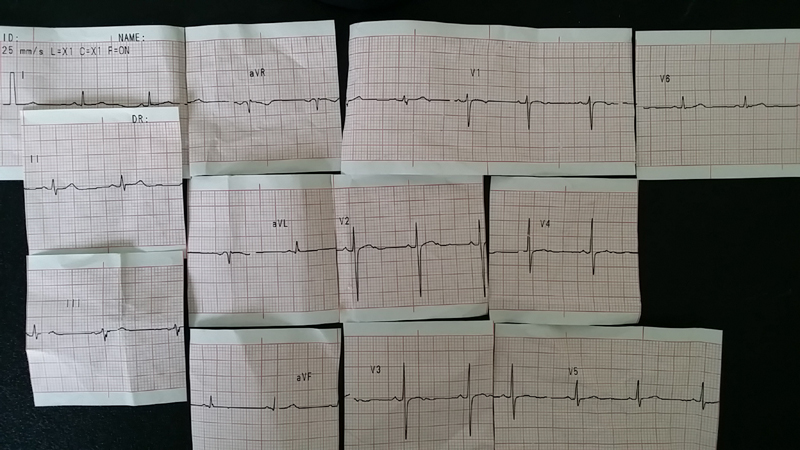
What I found in this ecg are QRX axis is normal range, p wave, pr interval, rr segment, st segment, qrs interval, qt interval, rythem...all of them are normal range.
However R waves in lead I, II, III are short which means low voltage, and R waves in v2 is long.
You can see R' R" in lead III(hypertropy ??).
What is your impression in this ECG. Thank you so much!
Could you read the attached ecg
What I found in this ecg are QRX axis is normal range, p wave, pr interval, rr segment, st segment, qrs interval, qt interval, rythem...all of them are normal range.
However R waves in lead I, II, III are short which means low voltage, and R waves in v2 is long.
You can see R' R" in lead III(hypertropy ??).
What is your impression in this ECG. Thank you so much!