- Joined
- Mar 15, 2014
- Messages
- 403
- Reaction score
- 107
So I was reading through TBR's explanation of this process and came across something strange
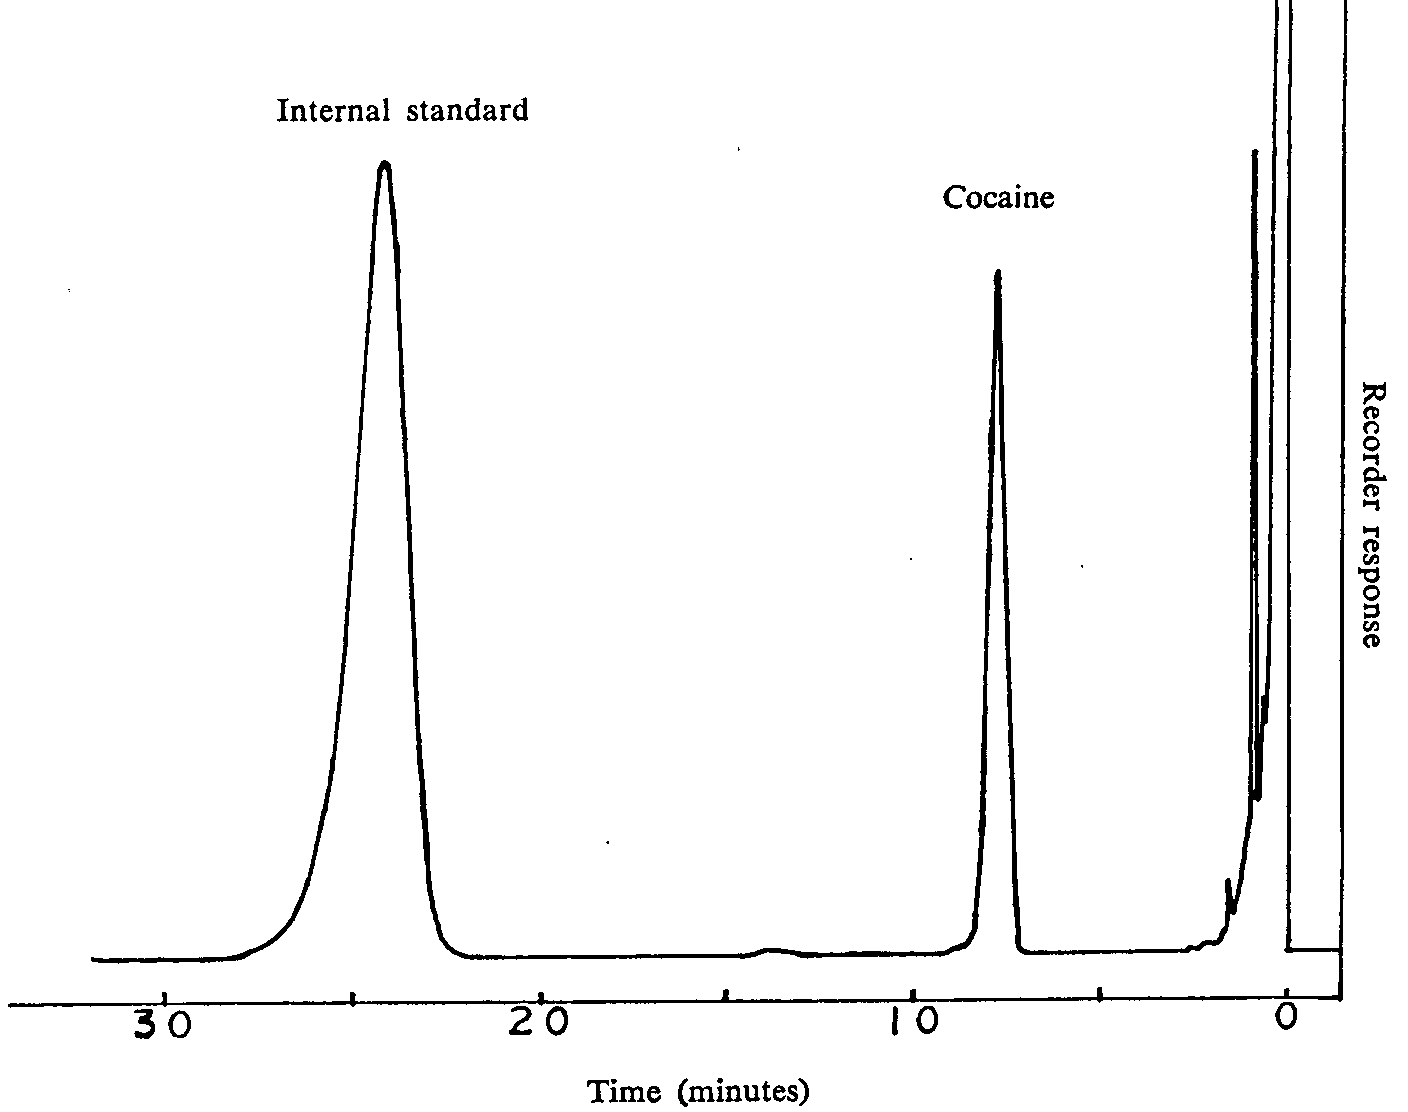
"GC output is continuous, so the graphs are actually read from right to left, where signals on the right represent components with smaller elution times than components on the left. To determine purity of a product mixture, the graph can be read directly"
The first part confused me because if we look at a retention time (x-value) vs. intensity (y-value) graph a longer retention time would normally mean the gas spent a longer time in the column and therefore had a longer elution time. But the description above would imply the opposite.
Can anyone explain what TBR meant?

