WedgeDawg's Applicant Rating System (Updated Jan 2017)

This forum made possible through the generous support of SDN members, donors, and sponsors. Thank you.
I'm asking does your 'category system' not apply to me because I don't have significant research?

If you're not interested in research, it'll be hard to justify why you want to go to a research powerhouse where >90% of the applicants have research and their mission statement strongly emphasizes research. Can it be done? Yeah - that's why 5-10% of the class gets in who didn't have research experience before (liberal estimate since that 5-10% might have had extenuating factors that prevented them from getting research experience and likely had something amazing about them that the school wanted - change of career, for instance). So you shouldn't count on being in that 5-10% but it doesn't hurt to apply to a few top choices (if you have the money) but you can also focus on the schools that emphasize primary care more.

Members don't see this ad.
 
  • Like
Reactions: 1 user
Latest version is 1.2.1 (Released 6/23/15) - changes are in red

6/23/15 Edit: New Excel document has been uploaded for version 1.2.1 (attached to OP).

Introduction


As some of you may have seen, I've recently been pioneering a new system that helps applicants figure out where they stand with respect to medical school admissions as well as giving them a place to start when it comes to creating a school list. My system is a comprehensive algorithm that takes into account all of the major (and some of the minor!) factors that go into building a successful application! This post aims to elucidate the process by which this method scores an applicant as well as get community input on the algorithm to attempt to strengthen it even more.

When I first started building this system, I used a google doc spreadsheet to make notes and create the initial versions of some of the formulas that go into this program. In order to do this, I scored myself, other applicants I knew in real life, and many applications I found in the What Are My Chances (WAMC) forum to adjust rating scales to try and create a generalized model that placed applicants into appropriate discrete categories.

Once I had my initial quantitative rating system in place, I wrote a Python script that allowed me to easily score an applicant based on factors normally included in their WAMC thread and which gives the output that I normally post in these threads. This is the point at which I started posting in threads as well to see how well my formulations matched up with community suggestions.

Finally, after some more tweaking, I created a comprehensive Excel document that contains instructions, qualitative descriptions of each factor that are then reduced to a numerical score, a place to input score values and receive a score in addition to a category level and school breakdown, and a page that displays which schools are in which categories. This document is available for download.

I will go through each of these factors in this post to articulate how they fit into the overall scoring paradigm as well as solicit input from the SDN community about how to increase the accuracy of this system.

The LizzyM System

This system was originally created as a supplement to, not a replacement for, the already widely-utilized LizzyM scoring system. As a reference, the LizzyM score is defined as (GPA*10)+MCAT and may contain a +1 or -1 modifier in certain situations. The applicant's LizzyM score is then compared to the LizzyM score for a school to determine whether or not the applicant is statistically competitive for that school. However, the inherent simplicity of the LizzyM score, while making it quick and easy to generate and apply, also creates problems endemic to systems that reduce and generalize. The two major simplifications are the reduction of an entire application to two (already numerical) metrics and the assumption that the LizzyM score accounts for the majority of, if not all of, the variability attributed to selectivity.

While there is merit to these assumptions, which is why the LizzyM score is so widely used, there are also deficiencies that need to be addressed in order to create a more accurate system for assessing an application. One of these deficiencies is that certain schools with similar LizzyM schools may be in very different levels of competitiveness. For example, although UVA and Duke have identical LizzyM scores, it is clear that Duke is a much more selective school than UVA. Additionally, small differences in LizzyM score become significant when using this metric to assess competitiveness for two similar schools. For example, Duke has a LizzyM score of 75, while Yale has a LizzyM score of 76; both schools are similarly selective, but someone might (very mistakenly) advise a applicant with a 3.9/36 that they are more competitive for Duke than they are for Yale. Finally, the LizzyM score is used as a way to tell if someone is statistically competitive for a single school and is significantly less useful for helping an applicant come up with a list of schools.

The Applicant Rating System - Overview

The WedgeDawg Applicant Rating System (ARS) was created to address these deficiencies. It takes into account most of the factors that make up an application to medical school, gives an applicant a separate score for each one, and then gives an applicant a numerical rating. This numerical rating is then translated to a category level and a profile of schools to apply to is created based on that category.

One of the major assumptions of the ARS is that applicants can be broadly classified in terms of competitiveness into one of 6 categories. Within these categories, distinctions between applicants are might lower than the differences between applicants that are in separate groups. Much of the variability that occurs between two applicants in the same group comes from subjective parts of the application that are not taken into account here, namely the personal statement, letters of recommendation, secondary essays, and their interviews. Because the purpose of the ARS is to create a starting point for a school list, these factors are not yet relevant. Indeed, the ARS does not assess where an applicant will be accepted; rather, it determines the best collection of schools for the applicant to apply to maximize chances of success at the best schools realistically possible.

The following factors are taken into account by the ARS:

  1. GPA
  2. MCAT
  3. Research
  4. Clinical Experience
  5. Shadowing
  6. Volunteering
  7. Leadership and Teaching
  8. Miscellaneous
  9. Undergraduate School
  10. Representation in Medicine
  11. GPA Trend
Each of these categories is assigned a score that corresponds to the strength of that portion of the application, weighted, and then summed together. The formula is as follows:

ARS Score = (Stats*5)+(Research*3)+(Clinical Experience [9, 5, -10])+(Shadowing [6, -5])+(Volunteering*2)+(Leadership and Teaching*2)+(Miscellaneous*3)+[(Undergrad-1)*3]+[(URM-1)*7]+[(Upward Trend-1)*4]

This score is then translated to one of 6 categories that applicants are grouped into, which are designated Levels S, A, B, C, D, E in decreasing score order. The score thresholds are as follows:

  • Level S: 85
  • Level A: 80
  • Level B: 75
  • Level C: 68
  • Level D: 60
  • Level E: 0
Note that the score is not out of 100 - it is in fact out of 121 if all factors are assigned the highest possible score. However, the raw number means very little when compared to the actual Level assigned to the applicant. Each level has its own profile of schools to apply to which are not parsed out by individual score.

School Categories and Applicant Profiles

Schools are similarly grouped into 7 broad categories by basis of selectivity. The categories are as follows:

Category 1 (TOP): Harvard, Stanford, Hopkins, UCSF, Penn, WashU, Yale, Columbia, Duke, Chicago

Category 2 (HIGH): Michigan, UCLA*, NYU, UWash*, Vanderbilt, Pitt, UCSD*, Cornell, Northwestern, Sinai, Baylor*, UNC*, Mayo, Case Western

Category 3 (MID): Emory, UTSW*, UVA, Ohio State, USC-Keck, Rochester, Dartmouth, Einstein, Wake Forest

Category 4 (LOW): Stony Brook, Vermont, Rush, SLU, VCU, Creighton, EVMS, NYMC, Albany, Commonwealth, Florida IU, Loyola/Stritch, RFU, SUNY Downst, VA Tech, Loma Linda, Quinnipiac, Oakland, Western MI, Cooper, Hofstra, MC Wisconsin

Category 5 (STATE): Your state schools if they do not appear elsewhere on this list - You should always apply to all of these if applying MD

Category 6 (LOW YIELD): BU, Brown, Georgetown, Temple, Jefferson, GWU, Drexel, Penn State, Tufts, Tulane

Category 7 (DO): DO Schools

Application profiles give the total number of schools an applicant should apply to in addition to the % of each category that should make up the total. Table 1 shows the score ranges, percentage of schools by category, total number of schools, and whether or not the applicant should apply to Category 6 or 7 schools. State schools should always be applied to if the applicant is applying to any MD schools.

TBZCcEn.png


RDExzik.png


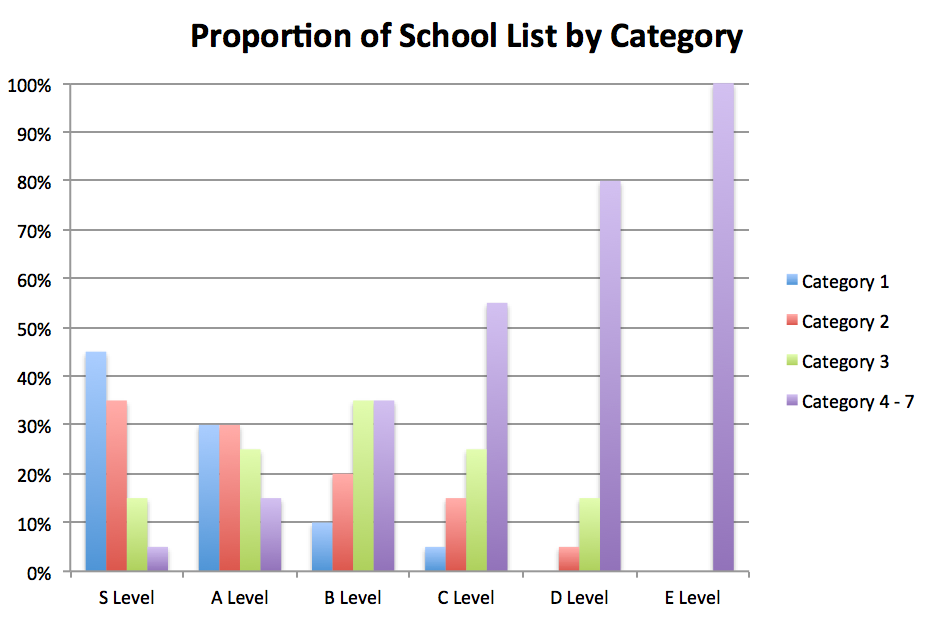
Figure 1 shows the proportion of school list by category for each applicant level. Note that Level E applicants should only be applying to DO schools, as shown in Table 1.

Scoring Methodology

This section will delineate each of the metrics used to score an applicant in all of the categories mentioned previously. The multiplier for the score will also be shown, as well as the score cap for the section.

Stats

Score Cap: 10
Multiplier: 5

The stats section is determined by a combination of MCAT and GPA. However, it is different from the LizzyM system in that scores are grouped into larger groups that then determines the Stats score for the applicant. This is because when using the LizzyM system, an applicant with a 2.9 and a 40 will be as competitive as someone with a 3.9 and a 30, while this is not true in practice (generally the latter will be more competitive). The LizzyM score appears to be less accurate at the extremes.

Table 2 shows how to determine an applicant's Stats score based on their MCAT and GPA. The number given in the table is the Stats score assigned.

iQdtnfI.png


This table was developed by a combination of Tables 24/25 published by AMCAS that gives an applicant's chance of success with certain MCAT and GPA as well as by individually looking at how applicants with certain combinations of GPAs and MCATs fared. Median, 10th, and 90th percentile GPAs and MCATs for schools in each category were also looked at when compiling this chart. GPA is averaged over all applicable fields - undergraduate sGPA, undergraduate cGPA, post-bac GPA, graduate GPA.

Score conversion percentiles were taken from the old MCAT percentiles chart (2012-2014) and the new MCAT percentiles chart (2015). The percentage of the old MCAT score was used as the floor for the percentage for the new MCAT. So if 24 was 40th percentile, 25 was 42nd, 490 was 39th, 491 was 40th, and 492 was 41st, then 24 would correspond to 491-492.

Research Experience

Score Cap: 5
Multiplier: 3

Level 5: Significant, sustained research activity. Generally, applicants in this category will have a first author publication, publication in a high-impact journal, and/or solo presentation of their own, original work at a major conference. These are the research superstars who are performing work well beyond the level of an undergraduate. PhDs will generally fall into this category, too.

Level 4: Significant, sustained research activity, generally for at least 2 years. Applicants in this category may have a poster presentation, a middle author publication in a medium- or low-impact journal, an abstract, or a thesis. These applicants have a strong research focus and perform research above the level of the average undergraduate.

Level 3: Moderate research activity, generally for a year or more. These applicants generally don't have publications or presentations, but may have completed a project.

Level 2: Slight research activity, generally for less than a year.

Level 1: No research activity.

Clinical Experience

Note that clinical experience can be volunteer or non-volunteer experience.

Score Cap: 3
Multiplier: +9, +5, -10 (by Level)

Level 3: Significant, sustained clinical experience, generally for well over a year. These applicants have demonstrated a strong commitment to clinical endeavors and have exposure in a clinical setting well beyond the average applicant.

Level 2: Moderate clinical experience, generally for well under a year. These applicants have adequate/sufficient exposure to clinical activity.

Level 1: Slight or no clinical experience.

Shadowing

Score Cap: 2
Multiplier: +6, -5 (by Level)


Level 2: Adequate shadowing or greater

Level 1: Slight or no shadowing experience.


Volunteering

Note that this section takes into account both clinical and non-clinical volunteering.

Score Cap: 3
Multiplier: 2

Level 3: Significant, sustained volunteering activity, generally over a long period of time, in one or multiple organizations. May also be working with marginalized or disadvantaged groups or in uncomfortable settings.

Level 2: Some volunteering activity, generally with low-to-moderate levels of commitment or sustained activity.

Level 1: Slight or no volunteering experience.

Leadership and Teaching

Score Cap: 3
Multiplier: 2

Level 3: Sustained, significant teaching and/or leadership experience. This category includes applicants who teach grade school students, go on a teaching fellowship, have TA'd or tutored for long periods of time, are the head of a major organization, or have other equally demanding responsibilities.

Level 2: Some teaching and/or leadership experience, often with low-to-moderate levels of commitment or sustained activity.

Level 1: Slight or no leadership or teaching experience.

Miscellaneous

Score Cap: 4
Multiplier: 3

Level 4: Highly significant life experiences or achievements that are seen as outstanding and contribute maximally to personal and professional development. This may include Rhodes scholarships, world class musicianship, professional or Olympic athletics, significant or sustained meaningful or unique work experiences, or anything else outlandishly impressive.

Level 3: Moderately-to-highly significant life experiences or achievements. This includes other terminal graduate degrees such as PhDs or JDs, military or Peace Corp service, as well as intense involvement with a unique or meaningful non-medical activity.

Level 2: Minimal-to-moderate involvement in personal activity or work experience. This may include major personal hobbies or athletics, musicianship, or other experiences.

Level 1: Nothing else to add.

Undergraduate School

Score Cap: 3 (really 2, 1, 0, but that's taken into account in the formula already)
Multiplier: 3


Level 3: Harvard, Yale, Princeton, Stanford, MIT

Level 2: All other "prestigious" or highly selective schools including other Ivies, Caltech, Duke, etc

Level 1: All other schools

Representation in Medicine

Score Cap: 2 (really 1, 0, but that's taken into account in the formula already)
Multiplier: 7

Level 2: Underrepresented in Medicine (URM)

Level 1: All other

GPA Trend

Score Cap: 2 (really 1, 0, but that's taken into account in the formula already)
Multiplier: 4


Level 2: Upward trend

Level 1: No upward trend

Discussion

There are a few problems associated with the ARS. First, it's tied mostly to MD applicants - it breaks down for people primarily applying to DO schools. It also doesn't have a real way to evaluate the competitiveness of MD/PhD applicants (or Lerner/Cleveland Clinic applicants). Second, it obviously does not take into account subjective factors such as how one talks about their experiences and it assumes that certain groups of applicants will be similar enough to group them based on an almost arbitrary cut-off (which could be contested). Finally, it does not have a great way of scoring people with multiple but very disparate GPAs (such as 2.9 undergraduate but 3.95 graduate).

Overall, this is just a tool for applicants to analyze themselves and figure out how to create a balanced school list that will offer them the optimal chance of success. I hope that it will not turn into a "check-box" machine where applicants will tailor their activities to try and "game" this system. Remember that it is not my system that is ultimately evaluating an application, it is a group of adcoms who do so through a process far more nuanced than this one. This is just a way to get an "at a glance" view of an application after it has been built. It is my hope that new applicants will use this system to help them construct a school list that is at the same time realistic and geared toward making them as successful an applicant as possible.

I would like community feedback regarding the algorithm in general. I will leave this thread up for a few days for people to comment, and then I will release an Excel spreadsheet that contains the most up-to-date information and algorithm so that people can very easily use it to rate themselves and others rather than having to do the math themselves. Thank you very much for reading and I hope that this becomes a useful metric for the SDN community and beyond.
Are there any more schools that fit the 'mid-tier' level?
 
I have created an online JavaScript calculator for the WARS score. It's not much, but it saves you from having to download the excel document (if you use it with this thread).

The excel file will be left here for those of you who want the comprehensive offline package.

Link to online calculator
 
  • Like
Reactions: 1 user
Members don't see this ad :)
I have created an online JavaScript calculator for the WARS score. It's not much, but it saves you from having to download the excel document (if you use it with this thread).

The excel file will be left here for those of you who want the comprehensive offline package.

Link to online calculator

Any way to make the output result a letter (i.e. S/A/B etc.) and not a number?
 
Any way to make the output result a letter (i.e. S/A/B etc.) and not a number?

Not with this particular tool unfortunately, which is why it's not standalone. If there was a python module or something I could use then yeah, but not with this, which is javascript.
 
Something about the GPA/MCAT category needs to be tweaked quite a bit. I agree with the others that it should be continuous, or at least as close to continuous as possible.

For example, my suggested list if I get a 515 MCAT is this:
upload_2016-6-29_11-24-38.png


And my suggested list if I get a 514 MCAT is this:
upload_2016-6-29_11-25-26.png


Those lists are way too different for a 1-point difference on the MCAT. It just doesn't make sense that the difference between a 511 and 517 produces the same exact result as the difference between a 514 and 515.
 
Last edited:
  • Like
Reactions: 1 user
Something about the GPA/MCAT category needs to be tweaked quite a bit. I agree with the others that it should be continuous, or at least as close to continuous as possible.

For example, my suggested list if I get a 515 MCAT is this:
View attachment 205649

And my suggested list if I get a 514 MCAT is this:
View attachment 205650

Those lists are way too different for a 1-point difference on the MCAT. It just doesn't make sense that the difference between a 511 and 517 produces the same exact result as the difference between a 514 and 515.

That's why it's just a tool to help construct your list - if you see that you're right on the border between two categories, it might be worthwhile to take elements from both to make your initial list and then tweak it. There is certainly a confidence interval involved, though you're right that it's not directly represented in the scoring system. But I'll definitely keep that in mind and see if later on I can incorporate some sort of confidence interval directly into the excel (or whatever I'm using) output.
 
  • Like
Reactions: 1 user
I have a hard time buying the "Stats" portion... It's basically saying that someone with a 3.6/39 will be viewed the same as someone with a 3.8/36 stats wise (and I even tried my best to avoid picking the very most extreme examples).

That seems really hard for me to believe. I could be totally wrong, though.

The system doesn't tell you how your application will be viewed by any particular school - it gives you an initial suggestion of where to apply. Assuming everything else is equal, it's very possible that a 3.8/36 and a 3.6/39 will have relatively similar school lists.
 
  • Like
Reactions: 1 user
I have a hard time buying the "Stats" portion... It's basically saying that someone with a 3.6/39 will be viewed the same as someone with a 3.8/36 stats wise (and I even tried my best to avoid picking the very most extreme examples).

That seems really hard for me to believe. I could be totally wrong, though.

Why wouldn't someone with a 3.6/39 apply to the same schools as someone with a 3.8/36? On 'the grid', both would have around a 90% chance of matriculating. Both would be looked at by top notch and 'regular' MD programs.
 
Why wouldn't someone with a 3.6/39 apply to the same schools as someone with a 3.8/36? On 'the grid', both would have around a 90% chance of matriculating. Both would be looked at by top notch and 'regular' MD programs.

They might be viewed in the same light if all else were equal, but rarely is all else equal. The applicant with the 36 MCAT may have went to an easier school and so the GPA doesn't say much.
 
They might be viewed in the same light if all else were equal, but rarely is all else equal. The applicant with the 36 MCAT may have went to an easier school and so the GPA doesn't say much.
Dude no. The kid got a 36. The difference between a 36 and a 39 isn't that huge. Once you pass a 35 and your GPA is greater than a 3.6 it's going to come down to the rest of your application. Not your stats.
 
And again, nobody is saying the two applicants will be looked at the same, just that they might apply to the same places.
 
  • Like
Reactions: 1 user
Members don't see this ad :)
Dude no. The kid got a 36. The difference between a 36 and a 39 isn't that huge. Once you pass a 35 and your GPA is greater than a 3.6 it's going to come down to the rest of your application. Not your stats.

You're missing the "all else being equal" part. Read my statement again. If all else were equal, these two applicants may be viewed in the same light. Again, very rarely is all else equal.
 
Guys, the WARS is used for designing school lists, not predicting where you'll get interviewed/accepted nor assessing how a school will view your application. So two comparable applicants (in regards to the 3.6/39 vs 3.8/36 example above) will have similar school lists.
 
  • Like
Reactions: 1 users
Ouch, lack of shadowing appears to hurt me a lot here. Hopefully not a dumb question, but CAN scribing count for shadowing?
 
  • Like
Reactions: 1 user
@WedgeDawg What does "low yield" mean for category 6, and why do you recommend top students not apply there?

Low Yield schools are those who receive an astronomical number of applications and only admit a small fraction of them. I can let WedgeDawg elaborate on why he doesn't recommend top students apply - but I would surmise that those with very strong GPAs/MCATs may get overlooked at these schools simply because the school knows these students will have their pick of the litter.
 
  • Like
Reactions: 2 users
Gosh dangit, I thought GPA meant cumulative GPA only and psyched myself up thinking I was A-tier when at present, I'm not... Hopefully by the end of this year!

Do college classes taken during high school count (they were two math classes)? And what do "significant", "adequate" (under shadowing), and "high-impact" (under research) mean here? What does "significant" mean in other volunteering and teaching? My current plan is to shadow a VERY busy DO for a (gap) year; and the only high-impact journal I know of is Nature, but I wonder if Nature Communications (the journal my PI thinks my project could publish under) is also high-impact.
 
Last edited:
Since the cycle is almost done I guess I can compare how this worked out.

I scored a 85 on WARS, and I applied to most of the S schools. The only IIs I rec'd were from my state schools and Einstein (mid tier). I think this needs to consider ORM as a factor.
 
Since the cycle is almost done I guess I can compare how this worked out.

I scored a 85 on WARS, and I applied to most of the S schools. The only IIs I rec'd were from my state schools and Einstein (mid tier). I think this needs to consider ORM as a factor.

It does

ARS Score = (Stats*5)+(Research*3)+(Clinical Experience [9, 5, -10])+(Shadowing [6, -5])+(Volunteering*2)+(Leadership and Teaching*2)+(Miscellaneous*3)+[(Undergrad-1)*3]+[(URM-1)*7]+[(Upward Trend-1)*4]

Representation in Medicine

Score Cap: 2 (really 1, 0, but that's taken into account in the formula already)
Multiplier: 7


Level 2: Underrepresented in Medicine (URM)

Level 1: All other
 
My WARS was a 68, and I applied almost how your scoring system suggested before I saw this last year. The only tricky part is that I am from PA so guess where all my state schools happen to fall...

But i think this is incredibly helpful while compiling a school list.
 
Since the cycle is almost done I guess I can compare how this worked out.

I scored a 85 on WARS, and I applied to most of the S schools. The only IIs I rec'd were from my state schools and Einstein (mid tier). I think this needs to consider ORM as a factor.
Wedge may have already addressed this but it would be nice if he could somehow work state residency into his formula.

A 3.4 from Mississippi and a 3.4 from Ca are worlds apart.
 
Since the cycle is almost done I guess I can compare how this worked out.

I scored a 85 on WARS, and I applied to most of the S schools. The only IIs I rec'd were from my state schools and Einstein (mid tier). I think this needs to consider ORM as a factor.

Not supposed to predict your interviews. Just supposed to help you create a list.
 
It does

ARS Score = (Stats*5)+(Research*3)+(Clinical Experience [9, 5, -10])+(Shadowing [6, -5])+(Volunteering*2)+(Leadership and Teaching*2)+(Miscellaneous*3)+[(Undergrad-1)*3]+[(URM-1)*7]+[(Upward Trend-1)*4]

Representation in Medicine

Score Cap: 2 (really 1, 0, but that's taken into account in the formula already)
Multiplier: 7


Level 2: Underrepresented in Medicine (URM)

Level 1: All other


Yeah, it takes into account URM, not **ORM**.
 
Just wanted to say that updates are coming soon (should be before the end of the year), courtesy of one of our hardworking SDN colleagues!
 
  • Like
Reactions: 2 users
Just want to say that WedgeDawg's applicant rating system is an improvement over LizzyM score, since the former takes into account of extracurricular activities and unique experiences. It was immensely helpful when deciding where to apply.
 
  • Like
Reactions: 1 user
Yeah, it takes into account URM, not **ORM**.

This probably won't satisfy you but I did some pretty dumb statistical analysis with Excel and here's what I got:

I made a chart of data containing % of applicants accepted to MD school at certain MCAT/GPA range combinations. The GPA ranges used were 3.2-3.4, 3.4-3.6, 3.6-3.8, and 3.8-4.0 since anything below a 3.2 is unlikely to be competitive. I used MCAT ranges of 24-26, 27-29, 30-32, 33-35, 36-38, and 39+. I also did a total % accepted for each GPA range including all MCATs (so, for example, total acceptance rate for any applicants with a 3.8-4.0 GPA). I did this for White, Asian, and URM applicants using AMCAS Table 24 data (see links).

This gave me 3 columns with 28 data points each.

I then ran a 1-way ANOVA and got a p value of 0.0002.

Because Excel doesn't have post-hoc test capabilities (even with the data analysis plug-in), I then ran paired 2 tailed t-tests for each of the 3 categories against each other.

White vs. URM: p<0.001 ***
Asian vs. URM: p<0.001 ***
White vs. Asian: p = 0.77

White mean: 53.5
Asian mean: 49.5
URM mean: 74.0

White variance: 624.2
Asian variance: 673.3
URM variance: 276.4

Thus, according to this analysis, I don't think it makes a big enough impact to include a URM category. And it shouldn't really affect school choice anyway.
 
Since the cycle is almost done I guess I can compare how this worked out.

I scored a 85 on WARS, and I applied to most of the S schools. The only IIs I rec'd were from my state schools and Einstein (mid tier). I think this needs to consider ORM as a factor.

Also, sorry if this is a little creepy (I can delete this post if you want), but I used your WAMC thread to run my own WARS analysis on it, and even being extremely generous, the best I can get your score to be is an 83, which is in the A category, and being a little more realistic, it's most likely in the 77-79 range (I always advise being conservative when scoring yourself) which is the B category, so I'm thinking that you might have given yourself ratings that might have been a bit high.

However, based on your signature, you've been accepted, which is far and away the most important thing, so congratulations!! :)

I've improved a bit since the wamc, but you might be right about overestimation. Also, thanks for the p value analysis about ORM v White; I guess it might get overblown anyway.

In any case, it's a very helpful model. Thanks for putting in the work to make it and address my questions.
 
  • Like
Reactions: 1 user
I used this as well as WAMC to create a school list... I will show my results thus far in hopes of helping others.

LizzyM ~ 65

My ARS score according to the excel is 66 (Category D).

Category 4
Stony Brook
Vermont - II
Rush

SLU
VCU
Creighton
EVMS
NYMC
Albany

Commonwealth
Florida IU
Loyola/Stritch- II
RFU

SUNY Downst
VA Tech
Loma Linda
Quinnipiac
Oakland - II
Western MI- II

Cooper
Hofstra
MC Wisconsin

Category 5
State Schools (4 Schools) - 1 II

Category 6
BU
Brown
Georgetown
Temple
Jefferson
GWU
Drexel
Penn State

Tufts
Tulane

Other Schools not listed that I had luck at at:
West Virginia - II
Indiana - II

I was told to make my school list 80% from Category 4-7, 15% Category 3 and 5% Category 2.... I think that this was a great way to approach it. I applied to mainly category 4 schools. My state has 2 schools in Category 3 and 1 school in Category 2 that I applied to. I was told to apply to 30 schools, but chose 24-25 according to this list.

This is a great tool, Thank you Wedge Dawg!
 
Last edited:
  • Like
Reactions: 2 users
I think this system is mostly amazing. I forgot my exact score but I was around an S and A level (the highest levels).

There is one problem with it, though. It told me to apply to 30-45% of tier one schools and almost no low yield schools, but my LizzyM was only a 71-72. My score was so high because my ECs + other intangibles of my application were incredibly good. So, for me someone like me who had good stats but did not have amazing stats, yet had amazing service oriented ECs, my success in category 1 was was nada and my success in category 4 and 6, the *low* yield schools that I was recommended NOT to apply to, was amazing. I think in creating a guide this is super useful, and I was also impressed by the love that I did get in Category 2, but I would recommend looking at your application and considering applying to Category 4 and 6 regardless of this guide.

Also **** category 3, the mid-tier schools. I literally got all my II from the high tiers and low tiers with NONE in the middle. Weird

Thanks @WedgeDawg, this really helped in creating my list!
 
  • Like
Reactions: 2 users
Hi everyone! The much awaited update is here!

Version 1.3 (released Jan 2017)

Here's what changed:

1. Did a full revamp of the school list and designations. Up-to-date MCAT/GPA were looked at for each school and medical schools were moved around as needed. In order to create a good list of Tier 4 (LOW) schools, I looked at the number of OOS matriculants and the number of OOS applicants, and then divided (OOSmatriculants*100)/OOSapplicants to get the OOS factor (credit to @To be MD, a vital collaborator and the impetus for revamping the ARS). Schools with an OOS factor of >1 and then at least 40 OOS matriculants were then compiled into a list. I then went to the website of each of these schools and looked if these OOS matriculants were region specific (some were), and if so, these schools were removed from the list. Finally, If a school had 9.1K applicants or greater, they were removed from the list. What we have now is a list of schools with average stats available to all applicants regardless of state of resident. Schools that were not Tier 1 or Tier 2 that had >9.1K applications were designated LOW YIELD. Brown was also added to this category due to their extremely low interview rate.

2. Changed number of schools category E applicants should apply to from 30 to 20.

3. Changed wording of undergraduate school tier designation.

The OP has been updated with the new spreadsheet. Please let me know if there are issues.
 
  • Like
Reactions: 6 users
Hi everyone! The much awaited update is here!

Version 1.3 (released Jan 2017)

Here's what changed:

1. Did a full revamp of the school list and designations. Up-to-date MCAT/GPA were looked at for each school and medical schools were moved around as needed. In order to create a good list of Tier 4 (LOW) schools, I looked at the number of OOS matriculants and the number of OOS applicants, and then divided (OOSmatriculants*100)/OOSapplicants to get the OOS factor (credit to @To be MD, a vital collaborator and the impetus for revamping the ARS). Schools with an OOS factor of >1 and then at least 40 OOS matriculants were then compiled into a list. I then went to the website of each of these schools and looked if these OOS matriculants were region specific (some were), and if so, these schools were removed from the list. Finally, If a school had 9.1K applicants or greater, they were removed from the list. What we have now is a list of schools with average stats available to all applicants regardless of state of resident. Schools that were not Tier 1 or Tier 2 that had >9.1K applications were designated LOW YIELD. Brown was also added to this category due to their extremely low interview rate.

2. Changed number of schools category E applicants should apply to from 30 to 20.

3. Changed wording of undergraduate school tier designation.

The OP has been updated with the new spreadsheet. Please let me know if there are issues.

Great work by you and @To be MD

The updated WARS will be super useful
 
  • Like
Reactions: 1 users
@WedgeDawg I see that University of Washington was taken off the list since last time (I forget which category it fell into last time- I think "high") - is there any particular reason for this fall since last year? It now seems to just be under the state school category while other highly ranked state schools remain in the other groups. Just curious!
 
@WedgeDawg I see that University of Washington was taken off the list since last time (I forget which category it fell into last time- I think "high") - is there any particular reason for this fall since last year? It now seems to just be under the state school category while other highly ranked state schools remain in the other groups. Just curious!

Remember that ranking in this system doesn't necessarily have any bearing on how "good" a school is - it's about how competitive it is and who should apply. UWash is undoubtedly a top tier school - however, you should only apply if you are from a WWAMI because they accept almost exclusively from that region and functions as a state school for all of those schools. Now there are other state schools that are also top tier and are listed in category 1, but this is because 1) you should still apply there if competitive if you aren't a state resident (ie UCSF) and 2) some state schools should only be applied to by some applicants from a state (for example a person with a 3.6/31 from Virginia isn't competitive for UVA). For UWash, 1) you should only apply if you are apply from WWAMI and 2) every single applicant from a WWAMI should apply to UWash because of their relatively low MCAT score and high rates of interviewing in-state applicants. Thus, in this system, UWash is a category 5 (state) school because all in state applicants should apply and only in state applicants should apply.
 
  • Like
Reactions: 1 user
Remember that ranking in this system doesn't necessarily have any bearing on how "good" a school is - it's about how competitive it is and who should apply. UWash is undoubtedly a top tier school - however, you should only apply if you are from a WWAMI because they accept almost exclusively from that region and functions as a state school for all of those schools. Now there are other state schools that are also top tier and are listed in category 1, but this is because 1) you should still apply there if competitive if you aren't a state resident (ie UCSF) and 2) some state schools should only be applied to by some applicants from a state (for example a person with a 3.6/31 from Virginia isn't competitive for UVA). For UWash, 1) you should only apply if you are apply from WWAMI and 2) every single applicant from a WWAMI should apply to UWash because of their relatively low MCAT score and high rates of interviewing in-state applicants. Thus, in this system, UWash is a category 5 (state) school because all in state applicants should apply and only in state applicants should apply.

Ahh, makes sense. Great work by the way, as usual!
 
  • Like
Reactions: 1 user
Also sorry for the horrendous grammar on that last post - I'm on my phone and while autocorrect felt it prudent to proofread, I myself did not.
 
  • Like
Reactions: 1 user
:biglove::biglove::biglove:
 
Last edited:
  • Like
Reactions: 1 user
School Categories and Applicant Profiles

Schools are similarly grouped into 7 broad categories by basis of selectivity. The categories are as follows:

Category 1 (TOP): Harvard, Stanford, Hopkins, UCSF, Penn, WashU, Yale, Columbia, Duke, Chicago

Category 2 (HIGH): Michigan, UCLA*, NYU, Vanderbilt, Pitt, UCSD*, Cornell, Northwestern, Mt Sinai, Baylor*, Mayo, Case Western, Emory

Category 3 (MID): UTSW*, UVA, Ohio State, USC-Keck, Rochester, Dartmouth, Einstein, Hofstra, UNC*

Category 4 (LOW): USF-Morsani, Wayne State, Creighton, Oakland, SLU, Cincinnati, Indiana, Miami, Iowa, MC Wisconsin, Toledo, SUNY Downstate, Stony Brook, VCU, Western MI, EVMS, Vermont, WVU, Wisconsin, Quinnipiac, Wake Forest, Maryland

Category 5 (STATE): Your state schools if they do not appear elsewhere on this list - You should always apply to all of these if applying MD

Category 6 (LOW YIELD): Jefferson, Tulane, Tufts, Georgetown, Brown, BU, Loyola, Rosalind Franklin, Drexel, Commonwealth, Temple, GWU, NYMC, Penn State, Albany, Rush

Category 7 (DO): DO Schools

Is this comprehensive? There are 141 MD schools, right? Do the other ~70 schools not mentioned really all fall under Cat. 5 (state schools)? That seems crazy to me (since a lot are already mentioned in other categories). Off the top of my head Virginia Tech Carilion (private) isn't mentioned for example
 
Last edited:
Is this comprehensive? There are 141 MD schools, right? Do the other ~70 schools not mentioned really all fall under Cat. 5 (state schools)? That seems crazy to me (since a lot are already mentioned in other categories). Off the top of my head Virginia Tech Carilion (private) isn't mentioned for example

I think whatever that's not mentioned belongs to Category 4.
 
Is this comprehensive? There are 141 MD schools, right? Do the other ~70 schools not mentioned really all fall under Cat. 5 (state schools)? That seems crazy to me (since a lot are already mentioned in other categories). Off the top of my head Virginia Tech Carilion (private) isn't mentioned for example

It is as comprehensive as possible VA Tech is one of the few schools that doesn't fall neatly into any category. If I had to classify it, it would probably go under cat 6, but I don't really recommend applying to it unless you're a very low GPA but decent MCAT type candidate, and thus isn't broadly applicable to the majority of applicants. That would likely be one of the changes recommended after you create your initial list using the ARS and then post in WAMC to fine tune.
 
  • Like
Reactions: 1 user
It's not a matter of how good they are, it's a matter of how the schools are perceived by adcoms. I've been reading some literature (mostly blog posts and stuff) from applicants from schools and found that while MIT is a wonderful name for MD/PhD admissions, it doesn't seem to have the same pull for MD only (PM if you're interested in what I was reading). However, this was something I was struggling with initially - I just haven't found enough MIT datasets to accurately tell the "school effect" of MIT. As such, if people from MIT are willing to try this system out and see if they can get me some more data, that would be wonderful.


I haven't tested it to the extent to which someone might call "rigorous". Mostly I checked it against applicants and see if I and other people who generally give solid advice on WAMC threads (Goro, gyngyn, etc) would agree with what was given by this algorithm. Intuition played a major role in the fine-tuning of this formula - it's creation was inductive.

Really, it's the quantization of what is already generally already known at an intuitive level by most people giving good advice in WAMC threads. However, I am curious to see the predictive validity of it based on people in the current cycle.

As I said before, I used myself and others that I know in real life to fine-tune some of the numbers. However, I might argue that the predictive validity might be strongly affected by subjective aspects such as LORs, PS, interviews, etc that have a very strong impact on acceptances and interviews. If this algorithm does not predict acceptances particularly at highly competitive schools, I would guess that this would be a major factor to that effect.


I agree - however, keep in mind that the subjective parts of an application cannot be evaluated by this tool. This does not predict where one will get accepted, only where one should apply to maximize chances of an acceptance at the best school possible. It's not meant to predict specific acceptances, just acceptances in general to the best school that would be realistic for that applicant.


Thank you for your comments! I would just like to reiterate that this is a method for creating a school list - not for predicting acceptances. Many people who were successful in their application cycle applied to schools in ratios similar to the ones suggested by this algorithm. This is not a method to predict particular acceptances - I would argue that there is not a system that can accurately do that due to the enormous variability inherent to this process.


Please do and report your results!

Question: why is the selectivity of the school taken into account? A lot of people choose to go to certain colleges/universities/grad schools because of financial reasons or other reasons beyond their control. In my opinion, the "prestige" or the "ranking" of schools below the absolute top should not play a part in admissions decisions. No one should be penalized for attending their local state school vs. going to Duke or Princeton.
 
I don't consider academic probation to be a red flag as one can overcome this by showing improvement. Upward trends are always good. We like underdogs and come-from-behind stories. It's in our DNA.

Even academic probation and removal (from a long time ago) followed by an aggressive upward trend ?


Sent from my iPhone using SDN mobile
 
  • Like
Reactions: 1 user
Question: why is the selectivity of the school taken into account? A lot of people choose to go to certain colleges/universities/grad schools because of financial reasons or other reasons beyond their control. In my opinion, the "prestige" or the "ranking" of schools below the absolute top should not play a part in admissions decisions. No one should be penalized for attending their local state school vs. going to Duke or Princeton.

Whether or not you think it should, fact is they are, which is why they are taken into account. It is by no means the most important aspect of the application.
 
  • Like
Reactions: 1 users
Edited because I accidentally posted too soon.

I used this rating system as well, and here was my results:

Scored in the A/S range depending on how whether I rated my clinical experience a 2 or 3 (couldn't decide). Ended up going with the A rating. Below's the breakdown of where I recommended to apply to vs. where I actually did (bolded = II).

Rec. -- Actual - Schools​
Category 1--- 30%--- 5%--- Chicago
Category 2--- 30%;---30%--- Case Western, Northwestern, Sinai, NYU, Pitt, Michigan
Category 3 --- 25%--- 10%--- OSU (state school though), Rochester
Category 4,5 - 15%--- 15%--- Cincinatti, Wright state, Toledo
Category 6 --- 0% --- 20%--- Tufts, Boston, Temple, Jefferson
Category 7 --- 0%---- 0%
Other --------- n/a --- 20% --- Cleveland Clinic, Illinois, Indiana, Louisville
Total ---------- 25 ---- 20

Takeaway: Overall this was a great system to use to make my school list, and though I still think it overrated me somewhat I should have wasted less $ on low-yield schools; of the one low-yield school I did get an II to, I think it's largely because I knew a student there and knew what to gear my secondaries towards. I didn't need to apply to 25 like recommended or even 20. I also saw a definite regional bias in who actually gave me interviews, so my results could have been much less positive if I have chosen, say, Vanderbilt, Cornell, and Mayo over Case, Pitt, and the Clinic.

Thanks Wedgedawg!
 
Last edited:
Curious. What would UC ( ucla undergrad ) fall under: lvl 1?

(UC is a state univ. )


Sent from my iPhone using SDN mobile
 
Top