D
deleted647690
I know that in a graph, when you see error bars, overlap indicates that there is not a statistically significant difference between the data points you are comparing.
With data presented in the form of the attached passage from the P/S section bank, where error is presented as + or - some number indicating the amount of error, can you similarly compare data points?
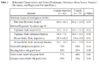
For example, in the data given, for the measure of "Distractibility task: Impulsivity", cocaine exposure gave a value of 29.5 + or - 12.8, while the control gave a value of 8.8 + or - 13.8
Is there something you can say here based on whether the error for condition overlaps or not?
Or would you just look at the p value? To answer the question attached to this passage which asked about the Impulsivity measure, I just looked at the p value, saw that it was below 0.05, and concluded that the difference between the control and cocaine exposure were therefore significant.
With data presented in the form of the attached passage from the P/S section bank, where error is presented as + or - some number indicating the amount of error, can you similarly compare data points?
For example, in the data given, for the measure of "Distractibility task: Impulsivity", cocaine exposure gave a value of 29.5 + or - 12.8, while the control gave a value of 8.8 + or - 13.8
Is there something you can say here based on whether the error for condition overlaps or not?
Or would you just look at the p value? To answer the question attached to this passage which asked about the Impulsivity measure, I just looked at the p value, saw that it was below 0.05, and concluded that the difference between the control and cocaine exposure were therefore significant.