
- Joined
- Dec 18, 2015
- Messages
- 3,216
- Reaction score
- 4,930
finally, I’ve addressed the lack of a dmfs benefit on long term follow up of eortc multiple times on this thread yet you continue to bring it up. More non breast cancer events. That’s why breast cancer mortality was still lower in the rni group on long term follow up. The study was powered at the initial publication date. It wasn’t powered to see a difference beyond that time point. It’s important to power a study at a particular time point because that drives the number of patients you enroll. Beyond that time point you don’t take into account the event frequency and the important competing risks!
You can ignore the graph, but all these points are shown in the graph...Almost exactly what I'm saying. Suppose the following situation. Let's assume you powered a study to show a 10% risk reduction for a particular outcome at 5 years. You assumed the risk of that otucome without intervention was 50%. So you want to show that it improves to 45%. And for ease lets say that's a 200 patient study (each arm). Now you conduct th4e study and at 5 years you find that in the control arm the risk of the outcome was 80% without intervention and 82 with intervention. No way is a 2 patient differnece going to be statistically significant but the 10% risk reduction is there. This is probably why CALGB was postiive for paclitaxel and NSABP was not. This is also why if you enroll a low risk population on study or survival improves for other reasons (such as lead time bias), an intervention may be successful at the rate you expect, but the study will still be negative.
Suppose the second situation. Let's take a patient population of 75 year old Females with some disease. We want to see if an intervention reduces a particular outcome X or death at 5 years. Let's take the same numbers 50% risk of death or X and 100 patients each arm. The 5 year study shows that there is a benefit. However in 10 years 80% of the 75 year olds are deadin both arms. There will be no benefit at 10 years.
Powering a study has to be taken into understanding the outcomes of a trial.
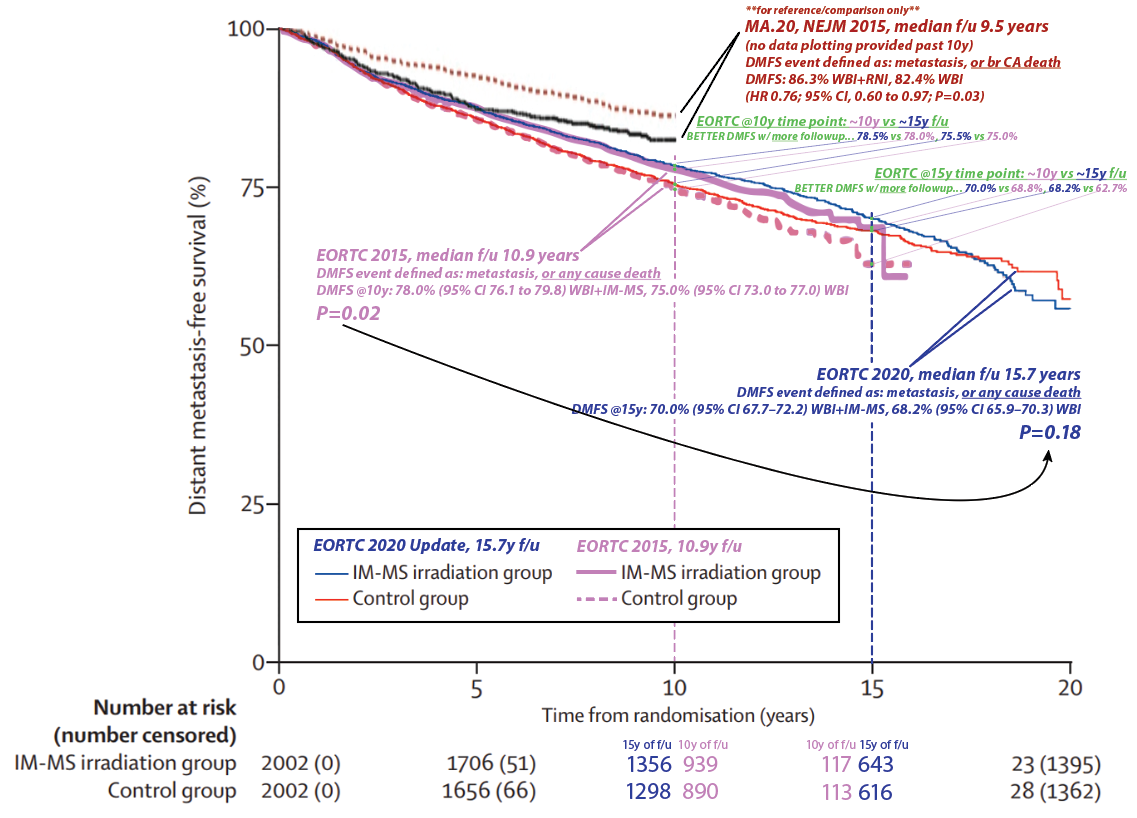
- Re: power. With 15y vs 10y median folowup, there are more patients at risk and thus (presumably) more power at the 10 year and 15 year time points. For example, at the 10 year time point, with 10y median f/u, there were 890 patients at risk in the control group. With 15y median f/u at the 10y time point, there were many more at risk thus evaluable: 1298. So a 10y DMFS estimate is "more robust" (and would always have "tighter" 95% CI's) w/ 15y median f/u vs 10y median f/u...
- EORTC w/ 10y followup showed a 10y DMFS benefit. Now w/ 15y fu, the 10y timepoints are actually slightly higher and the deltas are exactly the same: 3% at 10y. This is data maturity. To reiterate #1: we can now make better assessment of the 10y DMFS with 15y median followup than we could at 10y median followup.
- So why did EORTC at 15y f/u lose significance vs DMFS result at 10y f/u? "...I’ve addressed the lack of a dmfs benefit on long term follow up of eortc... More non breast cancer events." It may or may not be because of excess non-breast cancer deaths (the MA.20 only looked at mets & breast cancer related deaths in its DMFS analysis FWIW), but this is not hinted at in the results section (nor in the curves themselves, see #4). And you'd have to see a "speeding up" of the hazard function in one curve vs a "slowing down" in the other. It depends on how the hazard functions behave over time...
- Here's making the specific point. With ~10y median f/u, the 15y DMFS Kaplan-Meier estimate was 68.8% vs 62.7% (see the green text). This is a delta of 6.1%, and even though there's only 10y median followup this large delta in the curve contributes to the p=0.02 when looking at the OVERALL DMFS difference. Then, with 15y median f/u, the 15y DMFS estimate was better in both arms: 68.8%→70.0% and 62.7%→68.2%. So even with the "risk" of excess non-breast cancer deaths as you say with more f/u, the DMFS rates GOT BETTER AT 10 AND 15 YEARS WITH MORE FOLLOWUP. (In fact 15 vs 10y f/u meant better DMFSs at every single time point... 1y, 2y, etc.) But the 15y DMFS delta decreased from 5.9 to 1.2%, now the p=0.18 with more data maturity. It certainly appears to be there is more of a "curve cross-over" later in time... w/ better DMFS w/o RNI, in the 15y median f/u data. As you know, survival analysis "values the whole curve and not isolated points." This is why e.g. in EORTC 2015 the 10y DMFS was 78.0%(76.1-79.8) vs 75.0%(73-77); there is substantial 95% CI overlap here AT THIS TIME POINT but the p=0.02 values the whole curve. The curve evolves with longer followup times (or crossing censors over into events with better data collection; ~10% of the EORTC patients were censored/lost to followup).
Last edited:


")