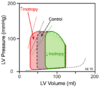
Every point on the PV loop is a ratio between Pressure vs. Volume. y= Pressure and x= Volume. When you increase contraction, you shift the line left. Which means you get more volume pumped out for the same amount of pressure. (you get less End systolic Volumn = higher SV = higher EF, this is proof that it was pumped harder)
Compare that to increase in Afterload such as Aortic stenosis, you will get a taller PV loop, where you need higher Pressure to pump out the same amount of Volume @ the end of Isovolumic Contraction. (in contrast to the above, even though it looks like the y-axis is taller & higher Pressure, you get more ESV = lower SV = lower EF)
My point is a taller y-axis is not the only thing you should look for to check for an increase in Pressure.