
- Joined
- Jun 17, 2014
- Messages
- 63,099
- Reaction score
- 154,760
- Points
- 18,451
- Location
- Tot Chat
- Website
- forums.studentdoctor.net
NOTE: This analysis is obsolete and is superseded by a simple calculator. Nonetheless, I kept the report as is just to see how a statistical analysis alternative to a regression can be done.
This report will address a new method of converting from the 2015 MCAT scale (or really any MCAT scale) into the old, 45-point scale. Superficially, it seems similar to my previous analysis on LizzyM scores, but I felt the model was of immediate importance (since people don't have to repeatedly consult AAMC Conversion Tables).
Percentile Curve
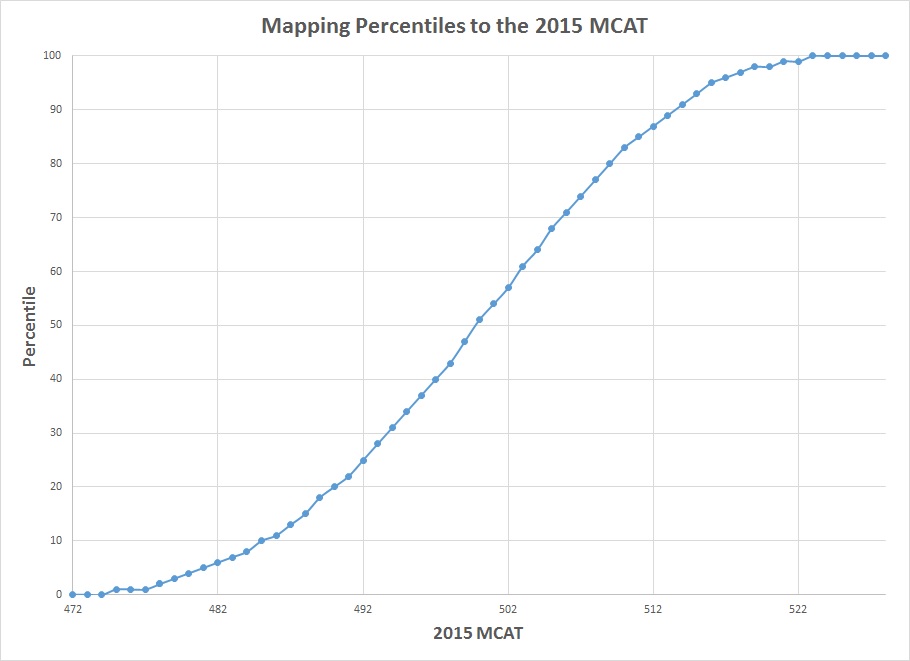
@efle previously provided useful AAMC conversion/comparison tables based on side-by-side percentile comparisons. When percentiles are plotted against the 2015 MCAT scores, we observe the following percentile curve.
Lawper's 5th/50th/95th Percentile Method
Generally, if we are modeling continuous distributions on data with bounded endpoints (like 0-45 or 472-528), we should stick with the so-called beta distribution. However, the methodology and application of the beta distribution is too complex for the general purposes, so we'll use simpler distributions that serve as unbounded approximations.
The key assumption involved is that the distribution of the MCAT scores resembles a normal distribution. From the AAMC April-May 2015 MCAT date, the reported MCAT mean and standard deviation are 500 and 10.6 respectively, but we will stick strictly with percentiles.
From the above percentile curve, the most linear part is marked between 5th and 95th percentiles. Keep in mind that even without the percentile curve attached, the 5th and 95th percentiles are useful benchmarks that represent the edges of the normal curve. Even in statistical inference tests, the standard p-value used for assessing significance is below 0.05 (but don't confuse percentiles with p-values).
The corresponding MCAT scores are 481 (5th percentile), 500 (50th percentile) and 516 (95th percentile). The MCAT spread is defined as 2 * (95th percentile - 5th percentile), and thus equal to 2 * (516 - 481) or 70.
Consequently, mapping the new MCAT scale to the old, 45-point MCAT scale can be determined by the following formula:
old MCAT = (45 / MCAT spread) * (new MCAT - lowest new MCAT + correction factor)
Or more simply:
old MCAT = (45/70) * (new MCAT - 472 + correction factor)
I added the correction factor because further analysis (credit to @efle for finding this) of the histograms comparing the old and new MCAT indicates that the 528 on the new MCAT does not correspond to a 45 on the old MCAT. Because 43-45 is virtually indistinguishable on the old MCAT as opposed to significantly more people scoring 526-527 on the new MCAT, the 528 on the new MCAT will actually correspond to a 43 on the old MCAT.
Setting the old MCAT = 43 and new MCAT = 528, the correction factor is equal to -98/9 or -10.889. The following model for comparing the 2015 MCAT to the old MCAT is the following.
old MCAT = (45/70) * (new MCAT - 461.11) (MCAT Conversion Model)
Rounding Methods
Rather than using the round function in Excel (which worsens the accuracy of the model), I decided to play around with the floor (rounding down to the nearest integer) and ceiling (rounding up to the nearest integer) functions. The most important number used is 506, since it serves as a useful benchmark for the lowest average MCAT score possible to be competitive for MD schools, although this may change based on more AAMC data. The so-called piecewise rounding occurs at the following intervals:
MCAT > 506 --> rounded down
478 < MCAT <= 506 --> rounded up
MCAT < 478 --> rounded down
This piecewise rounding ensures that the model's accuracy is better than that of a direct linear regression.
Data Analysis
Of course, another way to determine a formula for MCAT conversions is by plotting two MCAT scales based on AAMC Percentile Conversion Tables and carrying out a simple regression on Excel. But that's not fun and the derivation is way more complicated. Additionally, the two-sigma method only requires new MCAT scores for three percentiles, so plotting out all the data is unnecessary. Nonetheless, I decided to include both just for comparison and accuracy testing.
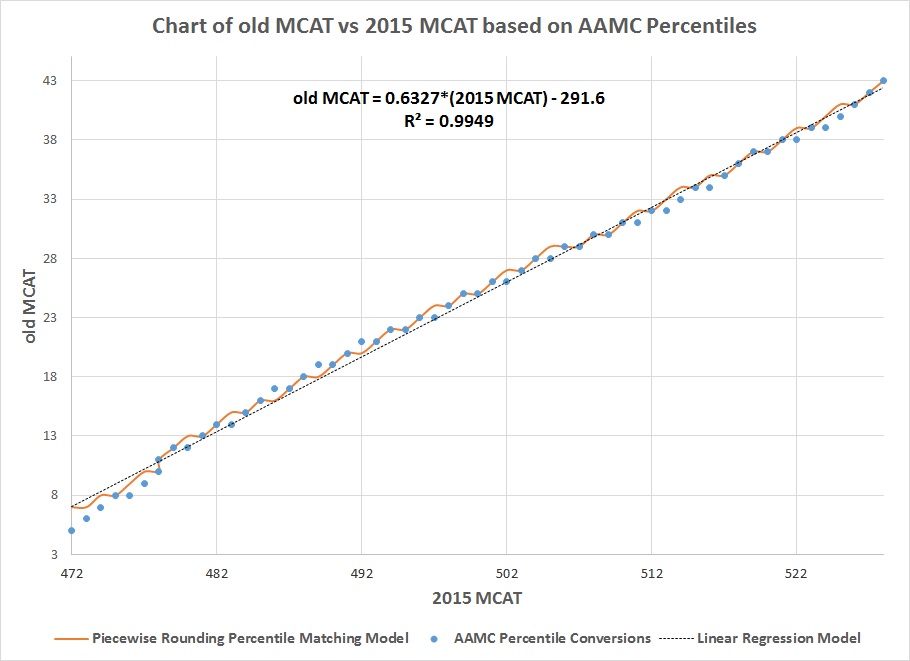
Applying piecewise rounding to a linear curve results in a graph of a series of steps.The R^2 for the model is about 0.996, so it fits very well to the plotted data and is superior to the linear regression model. Equally important is that the rounded off data is one point more than the actual reported MCAT equivalent in some cases where MCAT > 509, and is one point lower in some cases where MCAT < 504. But that is the consequence of trying to plot a linear model into a nonlinear data that looks linear.
LizzyM Scores
Since medical schools evaluate both the old and new MCAT based on percentile comparisons, the percentile-matching model is effective and even stronger than the previously reported score-conserving model. However, since strict matching was involved in analyzing AAMC data, the equivalent ranges from the model for the old MCAT are from 7 to 43 instead of 0 to 45 (the reported AAMC ranges are from 5 to 43). This means the LizzyM scores are shifted from 0 to 85 to 5 to 83.
Right now, I will keep the score-conserving model as it is until I get more AAMC MCAT percentile data sometime around the end of this year. But hopefully, this model is useful to you!
Let me know if you have any questions/concerns/complaints, as well as any problems you find.
This report will address a new method of converting from the 2015 MCAT scale (or really any MCAT scale) into the old, 45-point scale. Superficially, it seems similar to my previous analysis on LizzyM scores, but I felt the model was of immediate importance (since people don't have to repeatedly consult AAMC Conversion Tables).
Note the model produces the old MCAT in the range of 7 to 43, not 0 to 45, since it involved percentile matching and histogram analyses of AAMC percentile data. I will likely update it when more AAMC percentile data for the new MCAT are out, but for most important values, the model works well
old MCAT = (45/70) * (new MCAT - 461.11) (MCAT Conversion Model)
MCAT > 506 --> rounded down
478 < MCAT <= 506 --> rounded up
MCAT < 478 --> rounded down
old MCAT = (45/70) * (new MCAT - 461.11) (MCAT Conversion Model)
MCAT > 506 --> rounded down
478 < MCAT <= 506 --> rounded up
MCAT < 478 --> rounded down
Percentile Curve
@efle previously provided useful AAMC conversion/comparison tables based on side-by-side percentile comparisons. When percentiles are plotted against the 2015 MCAT scores, we observe the following percentile curve.
Lawper's 5th/50th/95th Percentile Method
Generally, if we are modeling continuous distributions on data with bounded endpoints (like 0-45 or 472-528), we should stick with the so-called beta distribution. However, the methodology and application of the beta distribution is too complex for the general purposes, so we'll use simpler distributions that serve as unbounded approximations.
The key assumption involved is that the distribution of the MCAT scores resembles a normal distribution. From the AAMC April-May 2015 MCAT date, the reported MCAT mean and standard deviation are 500 and 10.6 respectively, but we will stick strictly with percentiles.
From the above percentile curve, the most linear part is marked between 5th and 95th percentiles. Keep in mind that even without the percentile curve attached, the 5th and 95th percentiles are useful benchmarks that represent the edges of the normal curve. Even in statistical inference tests, the standard p-value used for assessing significance is below 0.05 (but don't confuse percentiles with p-values).
The corresponding MCAT scores are 481 (5th percentile), 500 (50th percentile) and 516 (95th percentile). The MCAT spread is defined as 2 * (95th percentile - 5th percentile), and thus equal to 2 * (516 - 481) or 70.
Consequently, mapping the new MCAT scale to the old, 45-point MCAT scale can be determined by the following formula:
old MCAT = (45 / MCAT spread) * (new MCAT - lowest new MCAT + correction factor)
Or more simply:
old MCAT = (45/70) * (new MCAT - 472 + correction factor)
I added the correction factor because further analysis (credit to @efle for finding this) of the histograms comparing the old and new MCAT indicates that the 528 on the new MCAT does not correspond to a 45 on the old MCAT. Because 43-45 is virtually indistinguishable on the old MCAT as opposed to significantly more people scoring 526-527 on the new MCAT, the 528 on the new MCAT will actually correspond to a 43 on the old MCAT.
Setting the old MCAT = 43 and new MCAT = 528, the correction factor is equal to -98/9 or -10.889. The following model for comparing the 2015 MCAT to the old MCAT is the following.
old MCAT = (45/70) * (new MCAT - 461.11) (MCAT Conversion Model)
Rounding Methods
Rather than using the round function in Excel (which worsens the accuracy of the model), I decided to play around with the floor (rounding down to the nearest integer) and ceiling (rounding up to the nearest integer) functions. The most important number used is 506, since it serves as a useful benchmark for the lowest average MCAT score possible to be competitive for MD schools, although this may change based on more AAMC data. The so-called piecewise rounding occurs at the following intervals:
MCAT > 506 --> rounded down
478 < MCAT <= 506 --> rounded up
MCAT < 478 --> rounded down
This piecewise rounding ensures that the model's accuracy is better than that of a direct linear regression.
Data Analysis
Of course, another way to determine a formula for MCAT conversions is by plotting two MCAT scales based on AAMC Percentile Conversion Tables and carrying out a simple regression on Excel. But that's not fun and the derivation is way more complicated. Additionally, the two-sigma method only requires new MCAT scores for three percentiles, so plotting out all the data is unnecessary. Nonetheless, I decided to include both just for comparison and accuracy testing.
Applying piecewise rounding to a linear curve results in a graph of a series of steps.The R^2 for the model is about 0.996, so it fits very well to the plotted data and is superior to the linear regression model. Equally important is that the rounded off data is one point more than the actual reported MCAT equivalent in some cases where MCAT > 509, and is one point lower in some cases where MCAT < 504. But that is the consequence of trying to plot a linear model into a nonlinear data that looks linear.
LizzyM Scores
Since medical schools evaluate both the old and new MCAT based on percentile comparisons, the percentile-matching model is effective and even stronger than the previously reported score-conserving model. However, since strict matching was involved in analyzing AAMC data, the equivalent ranges from the model for the old MCAT are from 7 to 43 instead of 0 to 45 (the reported AAMC ranges are from 5 to 43). This means the LizzyM scores are shifted from 0 to 85 to 5 to 83.
Right now, I will keep the score-conserving model as it is until I get more AAMC MCAT percentile data sometime around the end of this year. But hopefully, this model is useful to you!
Let me know if you have any questions/concerns/complaints, as well as any problems you find.
Last edited:
 I can understand your sentiment. But I just stuck with the simple normal distribution and did nothing fancy