Competition and Selectivity Analysis

This forum made possible through the generous support of SDN members, donors, and sponsors. Thank you.

Lawpy

42% Full Member
7+ Year Member
SDN Ambassador
Joined
Jun 17, 2014
Messages
63,099
Reaction score
154,758
Recently we have had a few threads and active discussion regarding recent the score creep in academic metrics. I would like to organize everything neatly into one clean thread based on these findings. More specifically, I wanted to focus on general competition and selectivity trends seen in US MD (AMCAS), US DO (AACOMAS) and Texas (TMDSAS) medical schools based on available public data.

Thanks to @LizzyM @gonnif @efle @Lucca @walloobi @libertyyne and the SDN community for active discussion, data analyses and collaboration.

Past threads and posts cited:
Sources used for data (in addition to commonly used AAMC Table A-16):

Applicants:
Internet Archive Wayback Machine
http://www.aacom.org/docs/default-source/data-and-trends/2011-14-AProfRpt.pdf?sfvrsn=26
http://www.aacom.org/docs/default-source/data-and-trends/2012-15-app-report.pdf?sfvrsn=10
http://www.aacom.org/docs/default-s...riculant-profile-summary-report.pdf?sfvrsn=10
TMDSAS Medical: Application Statistics

Matriculants:
Internet Archive Wayback Machine
https://www.aacom.org/docs/default-source/archive-data-and-trends/2011-Mat.pdf?sfvrsn=10
http://www.aacom.org/docs/default-source/data-and-trends/2012-15-matprofilerpt.pdf?sfvrsn=8
http://www.aacom.org/docs/default-s...riculant-profile-summary-report.pdf?sfvrsn=10
TMDSAS Medical: Application Statistics

Here are the results.

Trends in Total Number of Applicants and Matriculants


Solid lines represent total number of applicants; dashed lines represent total number of matriculants

AohnStK.jpg


Competition Trends

As per gonnif's definition, competition is defined as the applicant to seat ratio, so I divided total number of applicants by total number of matriculants.

4VvngR0.jpg


Competition growth curves can be found by calculating the percentage change in competition between consecutive years. Negative percent change means competition has decreased; positive percent change means competition has increased; decreasing positive percent change means competition is slowing down.

HtIonLK.jpg


Selectivity Trends

By gonnif's definition, selectivity is the academic and related metrics candidates are chosen on. To quantify selectivity, I used the matriculant LizzyM scores.

kB5ie4W.jpg


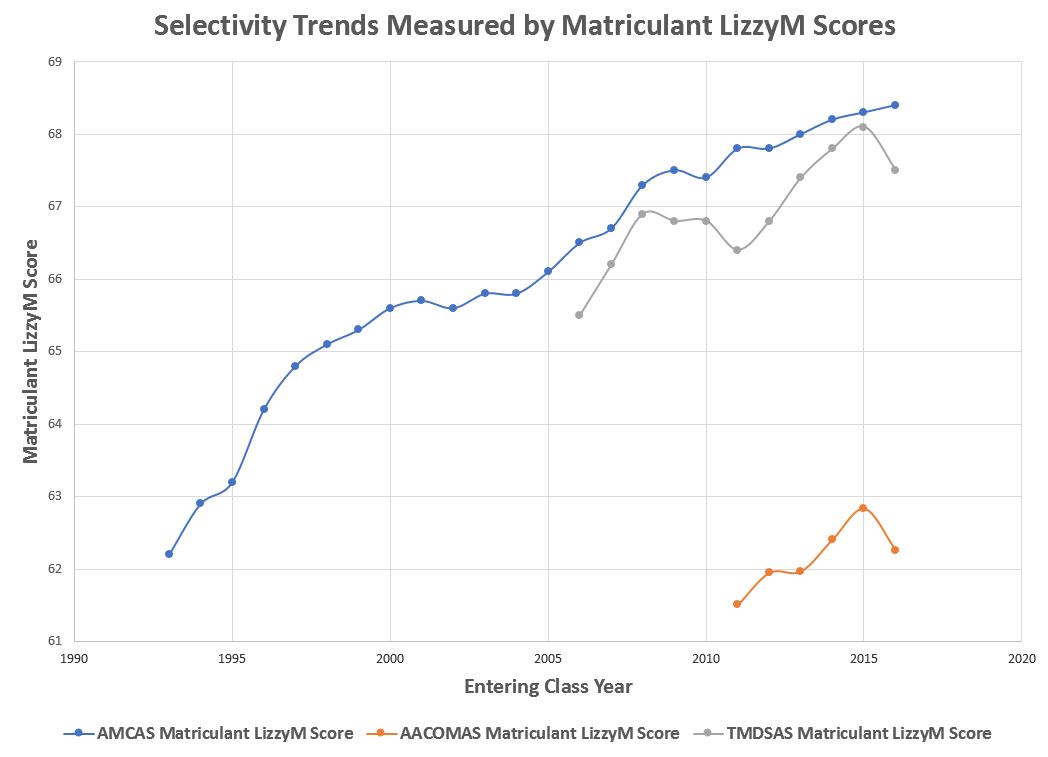
Selectivity growth curves can be found by calculating the percentage change in selectivity between consecutive years. Negative percent change means schools are becoming less selective; positive percent change means schools are becoming more selective; decreasing positive percent change means selectivity is slowing down.

HJT2I76.jpg


Competitiveness Score Trends for US MD Schools (by @walloobi )

The competitiveness score represents how difficult it is to get into medical school at any given year (higher number = more difficult to get accepted).

S0NtzTI.jpg


Changes in difficulty in getting into US MD school can be found by calculating the percentage change in competitiveness scores between consecutive years. Negative percent change means it is easier to get accepted; positive percent change means it is harder to become accepted.

fjYAI7z.jpg


Relationship between Selectivity and Competition

Selectivity-competition curves can be found by plotting matriculant LizzyM scores against applicant to seat ratios. Arrows are pointed in direction of increasing competition and selectivity.

Curves shifted to the right indicate higher competition.
Curves shifted to the left indicate lower competition.
Curves shifted up indicate higher selectivity.
Curves shifted down indicate lower selectivity.

G4Q5PZy.jpg


Enjoy! And feel free to leave your comments below.
 
Last edited:
Just a heads up if you have the motivation and time, you can use the internet archive/wayback machine to find AAMC data going back way into the 1990s.

For example on applicants, matriculants and their stats per year:

http://web.archive.org/web/20031209054154/http://www.aamc.org/data/facts/2003/2003mcatgpa.htm

THINGS POSTED TO THE INTERNET ARE FOREVER
This is beautiful, I'll definitely do some more competitiveness calculations later today with this data. Any idea how to find that data for 2004-2013? It seems to only go from 1992-2003
 
can one of you data gurus do a graph for SDN traffic over time? Curious to see if there is any correlation between LizzyM trends and SDN traffic
 
Recently we have had a few threads and active discussion regarding recent the score creep in academic metrics. I would like to organize everything neatly into one clean thread based on these findings. More specifically, I wanted to focus on general competition and selectivity trends seen in US MD (AMCAS), US DO (AACOMAS) and Texas (TMDSAS) medical schools based on available public data.

Thanks to @LizzyM @gonnif @efle @Lucca @walloobi @libertyyne and the SDN community for active discussion, data analyses and collaboration.

Past threads and posts cited:
Sources used for data (in addition to commonly used AAMC Table A-16):

Applicants:
https://web.archive.org/web/*/https://www.aamc.org/data/facts/
http://www.aacom.org/docs/default-source/data-and-trends/2011-14-AProfRpt.pdf?sfvrsn=26
http://www.aacom.org/docs/default-source/data-and-trends/2012-15-app-report.pdf?sfvrsn=10
https://www.tmdsas.com/medical/application-statistics.html

Matriculants:
https://web.archive.org/web/*/https://www.aamc.org/data/facts/
https://www.aacom.org/docs/default-source/archive-data-and-trends/2011-Mat.pdf?sfvrsn=10
http://www.aacom.org/docs/default-source/data-and-trends/2012-15-matprofilerpt.pdf?sfvrsn=8
https://www.tmdsas.com/medical/application-statistics.html

Here are the results.

Trends in Total Number of Applicants and Matriculants

Solid lines represent total number of applicants; dashed lines represent total number of matriculants

oU9HdIA.jpg


Competition Trends

As per gonnif's definition, competition is defined as the applicant to seat ratio, so I divided total number of applicants by total number of matriculants.

XLR1c9L.jpg


Selectivity Trends

By gonnif's definition, selectivity is the academic and related metrics candidates are chosen on. To quantify selectivity, I used the matriculant LizzyM scores.

Ff4rI8I.jpg


Trends in Selectivity/Competition Indices

I wanted to see how changes in selectivity and competition compare to each other, so I divided the two quantities. The selectivity/competition index decreases when competition rises faster than selectivity.

8tcNrZ0.jpg


Enjoy! And feel free to leave your comments below.
Alright I've finished calculating relative competitiveness scores from 1992 through 2016 (thanks for the data source @efle !)

Here's all the data I compiled/calculated/analyzed
upload_2017-3-1_11-26-45.png


The "competitiveness score" essentially represents how difficult it is to get into med school any given year (higher number = more difficult). From the averages and standard deviations of applicant GPAs and MCATs over the years, I found the LizzyM scores necessary to reach what I call the "threshold percentile," which is the percentile of LizzyM scores at which an applicant is in the top X percent of all applicants, where X is the overall acceptance rate for that particular year. This nicely integrates the dynamic acceptance rates with the dynamic GPAs and MCATs of the various applicant pools over time.

upload_2017-3-1_12-50-46.png


Quick note about the drop in competitiveness in 2016: we probably won't have solid recent competitiveness data until we better understand scores of the new MCAT; there was almost a 2-point drop in the average MCAT score of applicants this year (28.3 --> 26.56 aka 501.8), and no change in GPA mean or SD. There are a lot of variables here, so it might not make much sense to try to analyze the 1-year decrease in competitiveness too much, but it could be due to a very slightly increased acceptance rate combined with less people being able to accurately evaluate their MCAT scores (i.e. applying with low scores that they don't realize are low).

@efle brought up an interesting criticism regarding the fact that the GPA distribution certainly isn't normal, but after giving it some thought I don't think that should matter too much because although it's left-skewed, it's left-skewed every year, so our assumptions about relative changes should be pretty accurate even if absolute change analyses aren't perfectly accurate. The competitiveness score is necessarily arbitrary since we're using LizzyM (which is an arbitrary way to combine GPA and MCAT), so to some extent I'm okay with arbitrarily weighting GPA without paying much attention to the shape of the GPA distribution.

One last caveat: this analysis doesn't take into account GPA or MCAT inflation or deflation. If the increase in competitiveness were much more subtle, I'd try to do another analysis taking overall inflation/deflation into account, but there's a very strong upward trend in competitiveness over the past two and a half decades so I'm not too worried about the much more mild overall trends in GPA and MCAT inflation/deflation. There are a ton of complicated factors in inflation/deflation anyways, so I'm not sure I'd be able to accurately incorporate that data even if I tried.
 

Attachments

  • upload_2017-3-1_11-40-45.png
    upload_2017-3-1_11-40-45.png
    29.8 KB · Views: 139
Last edited:
Great stuff walloobi.

Would be interesting to adjust for the general rate of grade inflation for the last two decades (almost exactly 0.05 GPA points per 5 years). See gradeinflation.com.

How exactly are you calculating LizzyM for 2016? Using the old MCAT data? New MCAT data? Both?

I think the skew criticism still holds due to inflation. A 3.5, sigma .34 distribution might look a lot more like a bell than a 3.7, sigma .34 distribution could. So as time goes on the left skew actually grows worse each year. This is super minor though.

Final criticism would be the central assumption that if X% get in, it is the top X% of LizzyMs. We obviously know this not to be true (80+ people get rejected and people with a 60 get in every year) but I can't think of any adjustments.

Again very neato!
 
Alright I've finished calculating relative competitiveness scores from 1992 through 2016 (thanks for the data source @efle !)

Here's all the data I compiled/calculated/analyzed
View attachment 215572

The "competitiveness score" essentially represents how difficult it is to get into med school any given year (higher number = more difficult). From the averages and standard deviations of applicant GPAs and MCATs over the years, I found the LizzyM scores necessary to reach what I call the "threshold percentile," which is the percentile of LizzyM scores at which an applicant is in the top X percent of all applicants, where X is the overall acceptance rate for that particular year. This nicely integrates the dynamic acceptance rates with the dynamic GPAs and MCATs of the various applicant pools over time.

View attachment 215573

Quick note about the drop in competitiveness in 2016: we probably won't have solid recent competitiveness data until we better understand scores of the new MCAT; there was almost a 2-point drop in the average MCAT score of applicants this year (28.3 --> 26.56 aka 501.8), and no change in GPA mean or SD. There are a lot of variables here, so it might not make much sense to try to analyze the 1-year decrease in competitiveness too much, but it could be due to a very slightly increased acceptance rate combined with less people being able to accurate evaluate their MCAT scores (i.e. applying with low scores that they don't realize are low).

@efle brought up an interesting criticism regarding the fact that the GPA distribution certainly isn't normal, but after giving it some thought I don't think that should matter too much because although it's left-skewed, it's left-skewed every year, so our assumptions about relative changes should be pretty accurate even if absolute change analyses aren't perfectly accurate. The competitiveness score is necessarily arbitrary since we're using LizzyM (which is an arbitrary way to combine GPA and MCAT), so to some extent I'm okay with arbitrarily weighting GPA without paying much attention to the shape of the GPA distribution.

One last caveat: this analysis doesn't take into account GPA or MCAT inflation or deflation. If the increase in competitiveness were much more subtle, I'd try to do another analysis taking overall inflation/deflation into account, but there's a very strong upward trend in competitiveness over the past two and a half decades so I'm not too worried about the much more mild overall trends in GPA and MCAT inflation/deflation. There are a ton of complicated factors in inflation/deflation anyways, so I'm not sure I'd be able to accurately incorporate that data even if I tried.

So, I don't know where the data is right now or what thread it was posted in (I'll look for it later, @efle and @Lawper might remember) but as it turns out with the new MCAT, there was a drastic increase in applications from people with non-competitive MCAT scores who were (we speculate) misled by the AAMC's new guidelines of 500 = OK when we all know that's BS for most applicants. This is obvious from the AAMC tables for this cycle where lots of people were applying with 490-505 type scores when, normally, the number of people applying in that MCAT bin was much lower.

This aberration is most likely causing that data point to be way more skewed than it is because, if you look closely, there are only a very small number of examples (can count on 1 hand from the evidence I remember) where schools have actually *lowered* their matriculant means by any significant margin in response to the new MCAT.

tl;dr a large volume of applicants applying with borderline scores probably depressed the average numbers for this cycle but the applicant population is likely to self-correct in the future.
 
Great stuff walloobi.

Would be interesting to adjust for the general rate of grade inflation for the last two decades (almost exactly 0.05 GPA points per 5 years). See gradeinflation.com.

How exactly are you calculating LizzyM for 2016? Using the old MCAT data? New MCAT data? Both?

I think the skew criticism still holds due to inflation. A 3.5, sigma .34 distribution might look a lot more like a bell than a 3.7, sigma .34 distribution could. So as time goes on the left skew actually grows worse each year. This is super minor though.

Final criticism would be the central assumption that if X% get in, it is the top X% of LizzyMs. We obviously know this not to be true (80+ people get rejected and people with a 60 get in every year) but I can't think of any adjustments.

Again very neato!
Good points! maybe I'll update it taking into account grade inflation soon

To calculate LizzyM for 2016, I found the mean and SD for the new MCAT which are 499.6 and 10.4 respectively, looked at the applicant mean which is 501.8, calculated the percentile of 501.8 which is the 58.4th percentile, and found the 58.4th percentile of the old MCAT based on a mean of 25.2 and a SD of 6.4, which gives approximately 26.56. Added that to 35.5 (3.55 GPA * 10) to get a LizzyM of 62.06
 
Last edited:
So, I don't know where the data is right now or what thread it was posted in (I'll look for it later, @efle and @Lawper might remember) but as it turns out with the new MCAT, there was a drastic increase in applications from people with non-competitive MCAT scores who were (we speculate) misled by the AAMC's new guidelines of 500 = OK when we all know that's BS for most applicants. This is obvious from the AAMC tables for this cycle where lots of people were applying with 490-505 type scores when, normally, the number of people applying in that MCAT bin was much lower.

This aberration is most likely causing that data point to be way more skewed than it is because, if you look closely, there are only a very small number of examples (can count on 1 hand from the evidence I remember) where schools have actually *lowered* their matriculant means by any significant margin in response to the new MCAT.

tl;dr a large volume of applicants applying with borderline scores probably depressed the average numbers for this cycle but the applicant population is likely to self-correct in the future.
Yeah that makes a lot of sense, I expect numbers to bounce back to ~2015 levels in the next 2-3 years and then we'll probably see competitiveness continue to steadily increase like we see happening from 2011-2015
 
There are a lot of variables here, so it might not make much sense to try to analyze the 1-year decrease in competitiveness too much, but it could be due to a very slightly increased acceptance rate combined with less people being able to accurate evaluate their MCAT scores (i.e. applying with low scores that they don't realize are low).
.
"But I thought the top of the curve was the best!"

Blame AAMC? Lol
 
Good points! maybe I'll update it taking into account grade inflation soon

To calculate LizzyM for 2016, I found the mean and SD for the new MCAT which are 499.6 and 10.4 respectively, looked at the applicant mean which is 501.8, calculated the percentile of 501.8 which is the 58.4th percentile, and found the 58.4th percentile of the old MCAT based on a mean of 25.2 and a SD of 6.4, which gives approximately 26.56. Added that to 35.5 (3.55 GPA * 10) to get a LizzyM of 62.06
Yeah that makes a lot of sense, I expect numbers to bounce back to ~2015 levels in the next 2-3 years and then we'll probably see competitiveness continue to steadily increase like we see happening from 2011-2015
Lucca nailed it. Leave 2016 off for now, we can't use the applicant pool as a relative baseline because the rates of weak scores applying is much higher.
 
So, I don't know where the data is right now or what thread it was posted in (I'll look for it later, @efle and @Lawper might remember) but as it turns out with the new MCAT, there was a drastic increase in applications from people with non-competitive MCAT scores who were (we speculate) misled by the AAMC's new guidelines of 500 = OK when we all know that's BS for most applicants. This is obvious from the AAMC tables for this cycle where lots of people were applying with 490-505 type scores when, normally, the number of people applying in that MCAT bin was much lower.

This aberration is most likely causing that data point to be way more skewed than it is because, if you look closely, there are only a very small number of examples (can count on 1 hand from the evidence I remember) where schools have actually *lowered* their matriculant means by any significant margin in response to the new MCAT.

tl;dr a large volume of applicants applying with borderline scores probably depressed the average numbers for this cycle but the applicant population is likely to self-correct in the future.
Lucca nailed it. Leave 2016 off for now, we can't use the applicant pool as a relative baseline because the rates of weak scores applying is much higher.
But since the number of applicants and matriculants only increased very slightly (and the acceptance rate is essentially the same), the huge increase in people applying with bad scores must have been accompanied by a decrease in people applying with medium and high scores. That would make 2016 truly less competitive than 2015, wouldn't it?
 
Alright I've finished calculating relative competitiveness scores from 1992 through 2016 (thanks for the data source @efle !)

Here's all the data I compiled/calculated/analyzed
View attachment 215572

The "competitiveness score" essentially represents how difficult it is to get into med school any given year (higher number = more difficult). From the averages and standard deviations of applicant GPAs and MCATs over the years, I found the LizzyM scores necessary to reach what I call the "threshold percentile," which is the percentile of LizzyM scores at which an applicant is in the top X percent of all applicants, where X is the overall acceptance rate for that particular year. This nicely integrates the dynamic acceptance rates with the dynamic GPAs and MCATs of the various applicant pools over time.

View attachment 215578

Quick note about the drop in competitiveness in 2016: we probably won't have solid recent competitiveness data until we better understand scores of the new MCAT; there was almost a 2-point drop in the average MCAT score of applicants this year (28.3 --> 26.56 aka 501.8), and no change in GPA mean or SD. There are a lot of variables here, so it might not make much sense to try to analyze the 1-year decrease in competitiveness too much, but it could be due to a very slightly increased acceptance rate combined with less people being able to accurately evaluate their MCAT scores (i.e. applying with low scores that they don't realize are low).

@efle brought up an interesting criticism regarding the fact that the GPA distribution certainly isn't normal, but after giving it some thought I don't think that should matter too much because although it's left-skewed, it's left-skewed every year, so our assumptions about relative changes should be pretty accurate even if absolute change analyses aren't perfectly accurate. The competitiveness score is necessarily arbitrary since we're using LizzyM (which is an arbitrary way to combine GPA and MCAT), so to some extent I'm okay with arbitrarily weighting GPA without paying much attention to the shape of the GPA distribution.

One last caveat: this analysis doesn't take into account GPA or MCAT inflation or deflation. If the increase in competitiveness were much more subtle, I'd try to do another analysis taking overall inflation/deflation into account, but there's a very strong upward trend in competitiveness over the past two and a half decades so I'm not too worried about the much more mild overall trends in GPA and MCAT inflation/deflation. There are a ton of complicated factors in inflation/deflation anyways, so I'm not sure I'd be able to accurately incorporate that data even if I tried.

Great work! I'll add this to the original post.
 
But since the number of applicants and matriculants only increased very slightly (and the acceptance rate is essentially the same), the huge increase in people applying with bad scores must have been accompanied by a decrease in people applying with medium and high scores. That would make 2016 truly less competitive than 2015, wouldn't it?
Or the high number of weak new MCATs was offset by the old MCAT cohort being unusually strong, something like that. It was only the group of new MCAT applicants that had a big drop in success rates.
 
Or the high number of weak new MCATs was offset by the old MCAT cohort being unusually strong, something like that. It was only the group of new MCAT applicants that had a big drop in success rates.
Yeah that's a possibility, it would definitely be consistent with the extremely steady increase in competitiveness since 2002 (r=.973). Just updated the graph to only include data from 1992-2015 👍
 
OOOH - Can I play!?


I aggregated information from the old table A23 with 2013/4 - 2015/16 data to look at the distribution of applicant/matriculants by LizzyM. It ended up evolving into an analysis of the success rate of generalized GPA/MCAT combinations: High/Low, Low/Low, etc.

Purpose: To evaluate the success of Medical School applicants based on a qualitative assesment of their academic metrics.

Method: Using AMCAS Table A-23, I compiled data outlining the number of applicants and matriculants by GPA and MCAT over a 3 year period. I then assigned a letter code to each subset of GPA (A, B, C and D) and a number code to each subset of MCAT scores (1, 2, 3, 4). See Table 1 and 2. The GPA and MCAT of each group of applicants was then assigned a unique "ranking" based on the above which allows for a qualitative interpretation of academic metrics. For example, applicants with a GPA of 3.6 and an MCAT of 30 would be ranked as B3 and considered as "Competitive GPA/Competitive MCAT" applicants. Table 3 is a matrix of these descriptions. Finally, the matriculation percentage was calculated for each of the assigned ranking. Table 4 is the matrix of these results.

Table 1.
upload_2017-3-1_17-11-56.png


Table 2.

upload_2017-3-1_17-12-7.png


Table 3.

upload_2017-3-1_16-51-50.png


Table 4.

Cells are color-coded to pair reciprocal relationships. For example, cells highlighted in hunter green correspond to High GPA/Below Average MCAT (A2) and Below Average GPA/High MCAT (C4)

upload_2017-3-1_16-59-27.png


Conclusion: As expected individuals with both exemplary GPAs and MCATs perform the best, with a matriculation rate of 88%. The inverse also held true - those with poor performance on both the MCAT and in the class room performed the worst - 4.4% matriculation rate. It is also slightly more advantageous to have a higher MCAT in cases when one of the metrics is better than the other.
 
Last edited:
Just reporting a typo, I believe your competitive GPA bin should be "3.59-3.79" and below average GPA should be "3.0-3.4"
 
If I'm reading this right, you took the AAMC table and collapsed it into fewer bins?
 
If I'm reading this right, you took the AAMC table and collapsed it into fewer bins?

Hahaha, yep - and applied terms often used on SDN.

Fewer bins helped see the reciprocal relationships a bit better.
 
Update: I added some growth curves (found by calculating percent changes between consecutive years) for competition, selectivity and competitiveness scores. I also replaced the selectivity/competition index with selectivity-competition curves to see the relationship between the two quantities.
 
Top