
- Joined
- Apr 6, 2008
- Messages
- 1,667
- Reaction score
- 12
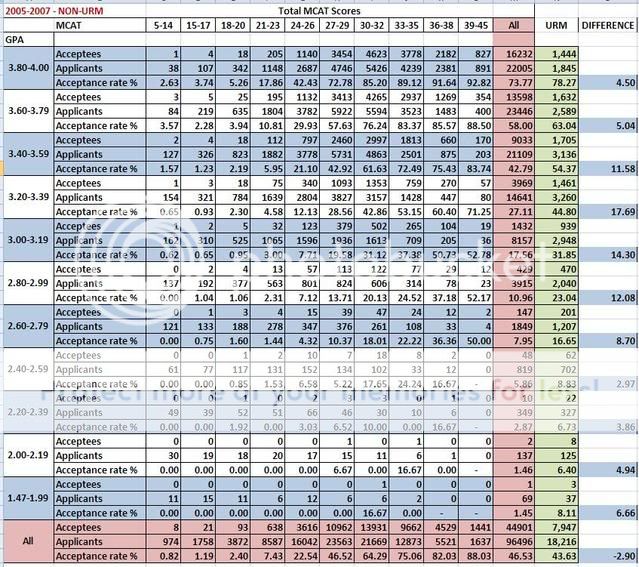
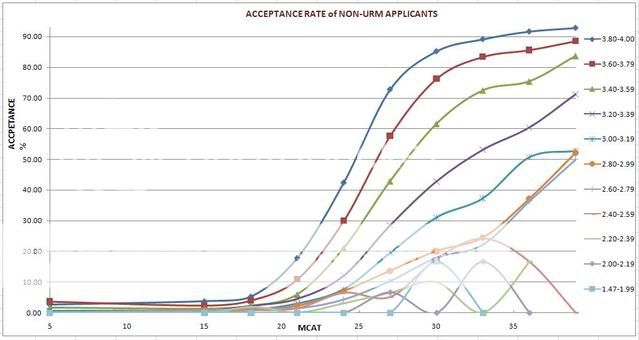
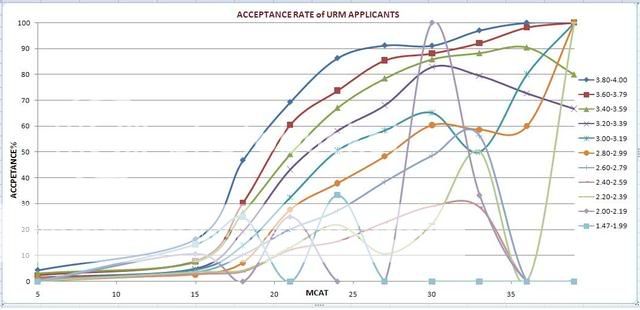
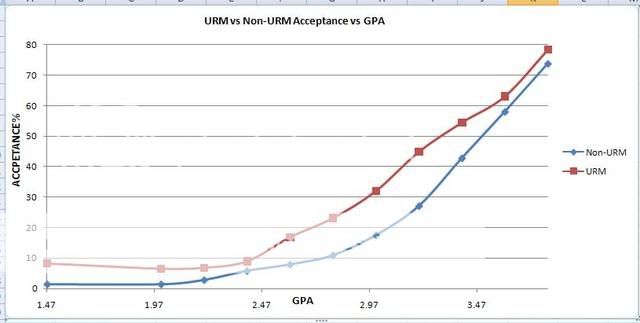
There is another thread floating around here concerning this Graph. Many people seem to to be confused about the data and what they are supposed to represent. Below I am providing graphs that separate out the numbers of URMs and non-URMs. As you will see yourself, in some cases the differences can be large, while in others they are negligible. The short answer to "Do I have a 20% chance of getting into medschool with below 20 MCAT and over 3.8 GPA" is no.
Enjoy:
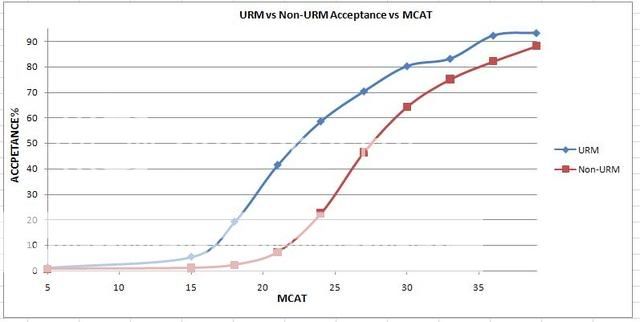
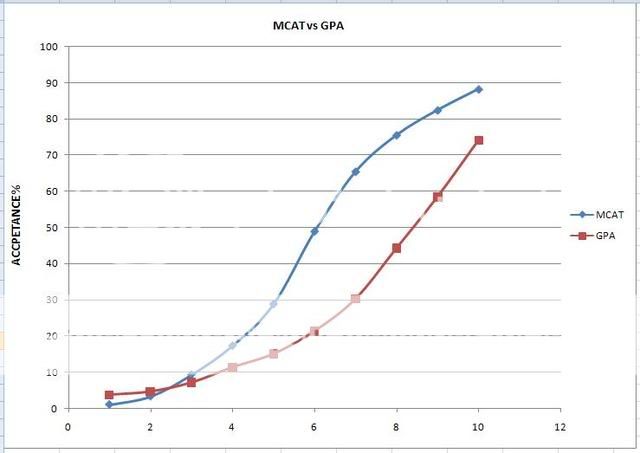
Note that the last graph finally puts the MCAT vs GPA question to rest. The choice of standardization here has been very generous: it was assumed that 2.0-2.19GPA=5-14MCAT, 3.8-4.0GPA=39-45MCAT. Considering that 20.79% of applicants have GPAs over 3.8 but only 1.47% have MCATs over 39, this graph would look much more favorable towards MCAT if I spent the time properly standardizing GPA vs MCAT correlation. I am attaching the Excel file in case some of you guys want to play with the data further.
Enjoy:
Note that the last graph finally puts the MCAT vs GPA question to rest. The choice of standardization here has been very generous: it was assumed that 2.0-2.19GPA=5-14MCAT, 3.8-4.0GPA=39-45MCAT. Considering that 20.79% of applicants have GPAs over 3.8 but only 1.47% have MCATs over 39, this graph would look much more favorable towards MCAT if I spent the time properly standardizing GPA vs MCAT correlation. I am attaching the Excel file in case some of you guys want to play with the data further.
") Maple is a program that's better suited for symbolic math.
Maple is a program that's better suited for symbolic math.