Interpreting error bars

This forum made possible through the generous support of SDN members, donors, and sponsors. Thank you.
6

663697

e8c5475fdc89ee05f831545933226c48.png

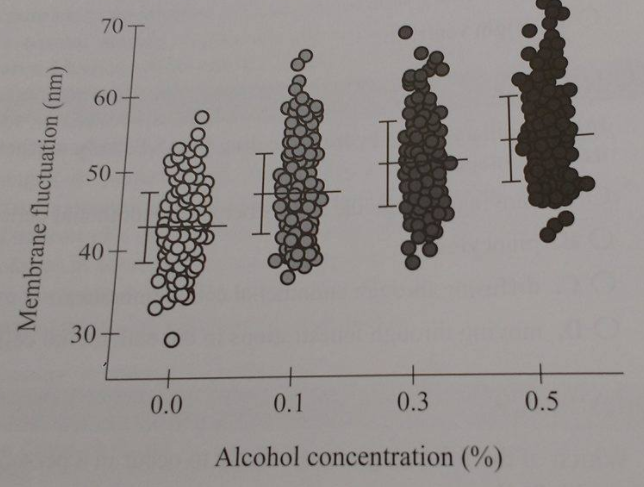
Given that the bars are overlapping in this graph, is it possible to conclude that increasing alcohol concentration increases membrane fluctuation? The answer from EK says it does but just wondering why the rule of overlapping error bars doesn't apply here.

Members don't see this ad.
 
Are you sure they're error bars and not interquartile ranges or something? Is there a legend for this figure? Normally, if error bars overlap, the difference is not statistically different (with 95% certainty).
 
Usually, scientists show bar graphs with error bars. When we show each individual data point as they do here, it's more likely than not that these are IQRs or something like that and not error bars. It would seem that if these were error bars, they should be wider given the spread of the data.
 
Top