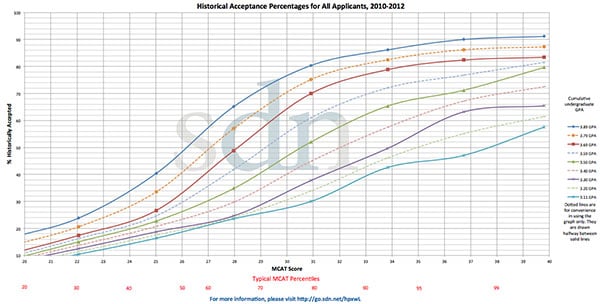
Success rate of those who applied with your cGPA and MCAT

This forum made possible through the generous support of SDN members, donors, and sponsors. Thank you.
Which GPA should you use? The GPA used in the graphs below is total undergraduate GPA. You may use this spreadsheet to calculate your GPA. For official information on how your GPA is calculated, look at the following AMCAS resource. Your AMCAS GPA may be different from your school's calculation.

Which MCAT should you use? The MCAT score represented in the AAMC data is for the most recent score for each applicant. Keep in mind that each medical school may have their own policy on how they view multiple test scores.

What percentages are displayed? The percentages displayed in this thread are the percent of applicants with one or more acceptance at a U.S. allopathic (M.D.) school. The historical acceptance percentage also varies depending on ethnicity/race. Those percentages are displayed in later posts. Also, note that this percentage is only based on two data points-- cGPA and MCAT. A variety of other factors go into each admissions decision, so this percentage should not be taken to mean "your chance at acceptance."
 
Last edited:

Figure 1 (click on graph for higher resolution)

Find the colored line closest to your cumulative undergraduate GPA (cGPA) by using the legend on the right. Then find your MCAT score on the x-axis. Your historical acceptance percentage is on the y-axis.

The solid lines correspond with the actual AAMC data. The dotted lines are merely interpolated lines drawn halfway between the solid lines.

Contour plot of the same data


Figure 2 (click on figure for higher resolution)
 
Last edited:
  • Like
Reactions: 1 user
Members don't see this ad :)
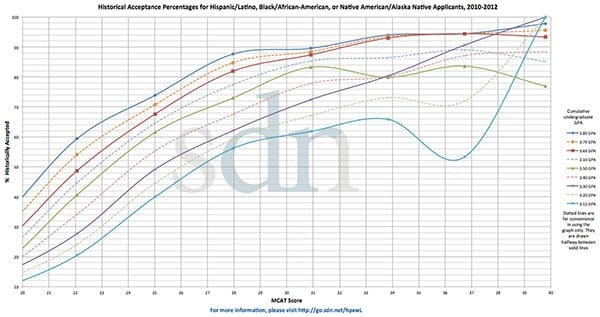
Chances for applicants who self-identify as Black or African American

Figure 4 (click on graph for higher resolution)

The chances do rise above 100% on this graph, but that's just because I prefer the smooth marked scatter graph in Excel.
 
Last edited:
  • Like
Reactions: 1 user
Chances for applicants who self-identify as Hispanic or Latino, Black or African American, or American Indian or Alaskan Native (combined)

Figure 7 (click on graph for higher resolution)
 
Last edited:
  • Like
Reactions: 1 user
Chances for applicants who self identify as White or Asian (combined)

Figure 8 (click on graph for higher resolution)
 
Last edited:
  • Like
Reactions: 1 user

Figure 10 (click on figure for GIF showing changes)


Figure 11 (click on figure for higher resolution)

The necessary information to create these graphs has been released five times (2005-2007, 2007-2009, 2008-2010, 2009-2011, and 2010-2012) but it appears that medical school admissions has grown more competitive since the 2005-2007 table was first created.
 
Last edited:
The data in this post is from last year. I'll work on updating it for this year when I get a chance.

Are underrepresented in medicine (URM) applicants with less-competitive stats taking large numbers of slots from overrepresented in medicine (ORM) applicants?


No, not large numbers.

From 2008 to 2010, an average of 18,752 students have been accepted into U.S. allopathic medical schools each year (2898 URMs accepted each year and 16,412 ORMs accepted each year. Some applicants marked multiple races or ethnicities). Only 1469 (7.8% of total accepted students) accepted students were URMs with a lower cGPA/MCAT combination than their White and Asian (ORM) counterparts.

Keep in mind that there are currently 6 medical schools that primarily accept URM students to fulfill their respective missions: Howard University College of Medicine, Meharry Medical College, Morehouse School of Medicine, Ponce School of Medicine and Health Sciences, Universidad Central del Caribe School of Medicine, and University of Puerto Rico School of Medicine. These schools combine for 513 seats per year. Not all of these 513 seats are exclusively for URMs; data available from U.S. News on three of the schools indicates minority student enrollment at 95.4%, 77.9%, and 95.2% for three of the six schools (the other three schools don't have information listed in the U.S. News database). The possible inflation of the 513 seats is mitigated by not including San Juan Bautista School of Medicine, which was accepting students through AMCAS for part of the 3 year time span represented in the Table 24 data.

After subtracting out the seats given to URMs at those 6 schools of medicine, there are approximately 956 seats (5.1% of total accepted students) given to URMs above what would be expected.

Please note that my definition of a URM applicant may be different from the definition each medical school uses. The current, official definition is found here. The definition represented by these stats is the old definition found at the same link, meaning applicants who self-identify as Black or African American, Hispanic or Latino, or American Indian or Alaskan Native (on SDN, usage of the acronym URM generally follows the old definition). In this terminology, the races overrepresented in medicine (ORM) are White and Asian.
 
  • Like
Reactions: 2 users
The data in this post is from last year. I'll update it as soon as I can with a current graph.

Which is better: a LizzyM score composed of a high GPA/low MCAT or the same LizzyM score created from a low GPA/high MCAT?


The available data suggests that your chances are slightly higher if your GPA contributes more to your LizzyM score.


Figure 12 (click on graph for higher resolution)

Blue dots: MCAT contributes more to your LizzyM score than the average matriculant (more than 46.6%)
Red dots: GPA contributes more to your LizzyM score than the average matriculant (more than 53.4%)
 
Members don't see this ad :)
Methods

Sources: The main sources are "Table 24: MCAT and GPA Grid for Applicants and Acceptees to U.S. Medical Schools, 2009-2011 (aggregated)" and "Table 25: MCAT and GPA Grid for Applicants and Acceptees by Selected Race and Ethnicity, 2009-2011 (aggregated)" from the AAMC. I also used data from the 2009, 2010, and 2011 MCAT examinee statistics and from "Table 17: MCAT Scores and GPAs for Applicants and Matriculants to U.S. Medical Schools, 2000-2011". All data is copyrighted by AAMC and is used for educational, noncommercial purposes.

GPA component: The GPA component is a skewed GPA based on a normal distribution of GPAs. I used the mean and standard deviation for 2009, 2010, and 2011 applicants listed in Table 17 to approximate the real average for each bin. AMCAS publishes a graph in the print edition of the MSAR (the MSAR is a highly recommended resource for additional information on applications and medical schools, with ordering information available here), but they do not publish raw numbers. Based on the data published for free by AMCAS, it is impossible to fine-tune the GPA calculation any further than using the median and SD.

MCAT component: The MCAT score for each data point is also skewed. The 2009, 2010, and 2011 MCAT examinee table gives the "percent achieving score" for every possible MCAT score. Since the mode of all scores is a 27 and the distribution is close to normal, the percent achieving each score gets lower as you move away from the mode. I decided to stick with the examinee statistics rather than the applicant statistics because the only data available is mean and SD, whereas the examinee stats are more detailed.

Acceptance percentage component: The acceptance percentages for figures 1-2 and 9 were calculated using the data from Table 24 referenced above. The percentages for figures 3-8 were calculated using Table 25.

Comment on skews: The graphs really didn't change much once I applied either the GPA or MCAT skew factors except at the limits of the data. For the 39-45 MCAT bin, the median score would be a 42. However, AAMC reports that 0.0% of all examinees scored a 43, 44, or 45. A better approximation of the bin is found using my method, yielding an average score of 39.8 for that bin.

Note on Dotted Lines in Figures 1, 3-8: The dotted lines do not correspond with any of the real data from AAMC. I just added in lines that are halfway between the solid lines so that it is easier to guess your chance.

Method for Figure 12:
The data points are derived using the same method explained above.
For my graph, LizzyM score is defined as MCAT+cGPA*10=LizzyM
The color-coding of the graph works by comparing the LizzyM score for the data point with the "average" percent contribution of matriculants (using an average at 32 MCAT and 3.67 cGPA). The average matriculant LizzyM of 68.7 comes 46.6% from MCAT and 53.4% from GPA. I used this as the baseline percentage, so any data point where GPA contributed more than 53.4% was colored red and data where GPA contributed less was colored blue.

Method for URM statistical comparison:
My two sources for data were the three Table 25 charts "MCAT and GPA for White," "MCAT and GPA for Asian," and "MCAT and GPA for Hispanic or Latino, Black or African American, or American Indian or Alaskan Native." For each MCAT and GPA combination, I found the percentage of White and Asian applicants accepted and multiplied it by the number of URM applicants. This gave me the number of URM applicants that I would expect to be accepted if the admissions process were completely equal i.e. race and ethnicity played no role. Next, I totaled up the "expected number of accepted URMs" (I got 4503.77 for the three year period) and compared it with the actual number of URMs accepted (there were 8693 URMs accepted over the three year period). The difference between the two numbers is 4189.22 URMs accepted beyond what we would expect for that three year window.

Now that I knew how many "extra" URMs were accepted beyond what would be expected, I found out the number of available seats at the 6 medical schools listed above. The rest of the calculations are straightforward.

Here's a step-by-step look at only one of the data points (students with an MCAT between 30 and 32 and a cGPA between 3.6 and 3.79):
3811 White acceptees+1298 Asian acceptees=5109 White or Asian acceptees
5146 White applicants+1761 Asian applicants=6907 White or Asian applicants
73.97% (or 0.7397) of White or Asian applicants in this range of stats were accepted
433 URMs applied with those same stats
We would expect 433*0.7397=320.3 of the URMs to be accepted if URMs had the same acceptance percentage as White/Asian applicants
(For this data point, 379 URMs were actually accepted, or 87.5% of the URM applicants)

How well does this method work? As validation of my overall method, consider the MCAT 30-32 bin and GPA 3.6-3.79 bin for all applicants. The percent chance given by Table 24 is 71.7%. The following data points from figure 1 are included in that bin:
Code:
GPA   MCAT  Acceptance %  
3.6     30          57% 
3.6     31          63% 
3.6     32          68% 
3.69    30          66% 
3.69    31          72% 
3.69    32          76% 
3.79    30          72% 
3.79    31          77% 
3.79    32          80%
[Note:I used the 3.59 GPA line for the 3.6 data]
The average % chance for the 9 points above is 70.1%, slightly below the real average from AAMC data.

Flaws in my methods include:

1. The GPA skew factor is based a normal distribution created by only mean and SD. The real data would be skewed differently if I had access to it. A graph showing GPA for actual allopathic applicants is available in the print edition of the MSAR but is unavailable due to copyright issues for my analysis.
2. Applicants to allopathic medical schools have higher MCAT scores than examinees, making my MCAT skew factor slightly off too. A graph showing MCAT scores for actual allopathic applicants is available in the print edition of the MSAR but is unavailable due to copyright issues for my analysis.
3. The dotted lines are not based on any real data, but are interpolated lines drawn in the middle of the "real" data lines.
4. It is impossible to create a line to represent a 4.0 GPA. Likewise, it is impossible to estimate chances with a MCAT score over 40.
5. Your chances also depend on your race/ethnicity, but the sample size for each data point shrinks for most of these graphs. Some counterintuitive trends can be noticed due to the small sample size.

Disclaimer:
The chances portrayed in this thread are not guaranteed by any means. I am merely presenting the best available data in a more accessible format. This thread is not meant to replace the "What Are My Chances" subforum. Every application is different, so your results will vary depending on a multitude of factors.

Previous editions from other posters:
Here are two other previous editions based on the same idea. Send me a PM if you find others!
http://forums.studentdoctor.net/showthread.php?t=606875
http://forums.studentdoctor.net/show....php?p=7731327

Acknowledgements:
Big thanks to Catalystik for her advice and encouragement from the beginning of this project, apumic for advice on the statistics, mauberley for the suggestion to add a disclaimer, TriagePreMed for input on layout issues, and VC7777 for the suggestion to clarify the meaning of "your chances".
 
Last edited:
  • Like
Reactions: 3 users
Deeply appreciate the data. I assumed, since the data are so detailed, that you probably have/know the access to the MCAT data the past few years.

Do you happened to be able to find out the number of people obtain MCAT scores 45 and also 44 from 2008-2011 each year?
 
  • Like
Reactions: 1 user

I am aware of the stats shown. I am not sure AAMC didn't show data on 44 and 45 because the numbers are small compared to the numbers of test takers and there were none?

Well, it can't be latter. My son's lab partner got 43 in 2011 and now at Columbia U.

I am just curious since the same topic was brought up a few times in MCAT Discussion forum in the past & no one seemed to have an agreeable answer.:idea:

Oh, sorry I misunderstood your question. Well, 0.0 of course does not mean exactly zero but rather a rounded figure. All that we can say from the data is that it is less than 0.1 percent of test takers (or < 86 people). I doubt anyone here has an exact figure and I'm sure it varies by a few dozen each year.
 
Deeply appreciate the data. I assumed, since the data are so detailed, that you probably have/know the access to the MCAT data the past few years.

Do you happened to be able to find out the number of people obtain MCAT scores 45 and also 44 from 2008-2011 each year?
As Saggy pointed out, I don't have any more specific data than the AAMC has released. Their data has been rounded to 0.0% for MCAT scores that high so I'm afraid I don't know how many people received those high scores
 
As Saggy pointed out, I don't have any more specific data than the AAMC has released. Their data has been rounded to 0.0% for MCAT scores that high so I'm afraid I don't know how many people received those high scores
I actually asked them how many had scored a 45. There answer was yes people have scored 45 but how many cannot be divulged. It is top secret.
 
I actually asked them how many had scored a 45. There answer was yes people have scored 45 but how many cannot be divulged. It is top secret.

I wouldn't say it's "top secret," merely not readily available. If you feel so inclined you may contact the AAMC directly for the data (though it's possible that you may have to pay a fee). As it stands, the published data doesn't present the statistics with that sort of precision probably because it is simply not relevant to most people. I doubt there's an air of secrecy shrouding the figures.
 
I wouldn't say it's "top secret," merely not readily available. If you feel so inclined you may contact the AAMC directly for the data (though it's possible that you may have to pay a fee). As it stands, the published data doesn't present the statistics with that sort of precision probably because it is simply not relevant to most people. I doubt there's an air of secrecy shrouding the figures.

Based on you guys comments, I suspected since it is not the "norm" data, they have to have someone to get into the database with a special "sort" and that needs special request from their "daily" operation and cost $$ :oops:. Well, what can I say.:mad:
 
Hm, there's something I'm having a hard time to interpret from those graphs. For the highest scorers (40 MCAT, 3.89 GPA), figure 1 shows a slightly below 92% acceptance rate for the entire applicant pool. However, when I look into the breakdowns by race, every race has an acceptance rate over 94%. How can the two remarks be consistent? Is there another race (or the 'undeclared' option) with an acceptance rate low enough to bring down the overall stat to 2% lower than that of whites and asians together?
 
Hm, there's something I'm having a hard time to interpret from those graphs. For the highest scorers (40 MCAT, 3.89 GPA), figure 1 shows a slightly below 92% acceptance rate for the entire applicant pool. However, when I look into the breakdowns by race, every race has an acceptance rate over 94%. How can the two remarks be consistent? Is there another race (or the 'undeclared' option) with an acceptance rate low enough to bring down the overall stat to 2% lower than that of whites and asians together?
You're right. I didn't notice that. I just checked the raw data (Tables 24 and 25 here https://www.aamc.org/data/facts/applicantmatriculant/) and I didn't screw up. That's how the data really is :shrug:

For reference, the data that I'm looking at on the raw tables is the acceptance percentage for applicants with a GPA between 3.8 and 4.0 and MCAT from 39-45

I don't know of a good reason why it is though. I suspect it has to do with
1)Applicants who don't designate a race or ethnicity so they don't show up in any of the race/ethnicity data
2)Applicants who designate more than one race/ethnicity so they show up multiple times in the race/ethnicity data
3)The number of applicants applying in that stat range is pretty low (only 1280 total over three years) so the right combination of #1&2, even for a small number of applicants, can lead to the strange outcome you pointed out
 
wow thanks. This is great. Too bad Im asian and not urm...we got the short end of the stick!
 
  • Like
Reactions: 1 users
Hmm quick question. I know these stats give you the percentage of getting into at least one medical school, but I'm sure that number changes based on how many schools are applied to. How does the number of schools factor in to analyzing the data from these graphs?
 
Hmm quick question. I know these stats give you the percentage of getting into at least one medical school, but I'm sure that number changes based on how many schools are applied to. How does the number of schools factor in to analyzing the data from these graphs?

Since that metric is not published, Sector probably assumed everyone applied to exactly 13 schools (the national average). Intuitively, one would assume that applying to more schools increases your chances, but by how much we don't know since we don't have the data.
 
Hmm quick question. I know these stats give you the percentage of getting into at least one medical school, but I'm sure that number changes based on how many schools are applied to. How does the number of schools factor in to analyzing the data from these graphs?
Sorry it took me a while to answer this. Like Saggy said, there isn't any data available on this topic. The only thing we know is that, on average, applicants apply to a little under 14 schools. Therefore, I would assume that applying to >14 schools would slightly increase the historical acceptance percentage and applying to <14 schools would decrease it. But by how much? I have no idea. I'm going to take a guess that it's not too much but you never know
 
just out of curiosity does this include DO schools or only MD?
 
:)

Greetings earthlings

Do you have similar DO statistics?

Excellent resource
 
Thanks for the charts.
Two questions. How would you explain the steep declines in the lower GPA trends when reaching high MCAT scores? (This is apparent in the Asian, URM (Hispanic, african american etc) charts. I'm kind of confused by this
Also, where would one factor in college courses taken while in high school in the AMCAS spreadsheet?
When people refer to their "cumulative Ugrad GPA" are they referring to ALL college courses taken (even while in high school) as well...or just what appears in the Ugrad institution transcript?
 
Thanks for the charts.
Two questions.
1. How would you explain the steep declines in the lower GPA trends when reaching high MCAT scores? (This is apparent in the Asian, URM (Hispanic, african american etc) charts. I'm kind of confused by this
2. Also, where would one factor in college courses taken while in high school in the AMCAS spreadsheet?
When people refer to their "cumulative Ugrad GPA" are they referring to ALL college courses taken (even while in high school) as well...or just what appears in the Ugrad institution transcript?
1. The steep declines are simply a case of decreased sample size at the extremes. Only a handful of acceptances (or rejections) can throw the curves way off track when you only have 20 people (random low number) applying at a given data point
2. These charts were created with cumulative undergrad GPA. In AMCAS terminology, that includes any college courses taken while in high school. The spreadsheet that I linked to in this thread doesn't appear to have a slot for high school classes. Perhaps you can use the spot for "post-bacc" to enter your high school stuff? If you have courses for all 4 years of college plus post-bacc, then just add the courses to one of the sections and remember that your GPA calculations per academic year are not trustworthy.
 
when will you update your graphs with the 2012 class?
 
Uh oh, what if I'm half Asian and half African-American?

You say you're black and take advantage of it. Unless your last name is asian.. then you might have a harder time pulling it off.
 
  • Like
Reactions: 1 users
When the statistics refer to "percent accepted," does that mean the percent of individuals accepted to any medical school or does it include multiple acceptances for each individual? I'm not sure if I'm making myself clear. I guess what I'm trying to ask is, does this mean that someone with a 3.9GPA and a 30 on the MCAT has an ~80% chance of being accepted ONCE, or does that person have an ~80% chance of acceptance to any of the schools s/he applies to?
 
When the statistics refer to "percent accepted," does that mean the percent of individuals accepted to any medical school or does it include multiple acceptances for each individual? I'm not sure if I'm making myself clear. I guess what I'm trying to ask is, does this mean that someone with a 3.9GPA and a 30 on the MCAT has an ~80% chance of being accepted ONCE, or does that person have an ~80% chance of acceptance to any of the schools s/he applies to?

It means that 80% of applicants with a 3.9/30 were accepted into a medical school.
 
When the statistics refer to "percent accepted," does that mean the percent of individuals accepted to any medical school or does it include multiple acceptances for each individual? I'm not sure if I'm making myself clear. I guess what I'm trying to ask is, does this mean that someone with a 3.9GPA and a 30 on the MCAT has an ~80% chance of being accepted ONCE, or does that person have an ~80% chance of acceptance to any of the schools s/he applies to?
Whoops, forgot to answer this. As grapepopsicle points out, the 80% means that 80% of people who applied with those stats got in to one or more school that they applied to. It doesn't say anything about how many schools they may have been accepted at. The 80% also doesn't relate to chances at any particular school.
 
how important is the undergrad school . everyone talks about gpa, but what about the school that you got that gpa from. i.e. 3.5 from arizona state vs. duke? how do the medical schools evaluate this?
 
how important is the undergrad school . everyone talks about gpa, but what about the school that you got that gpa from. i.e. 3.5 from arizona state vs. duke? how do the medical schools evaluate this?
This is a commonly debated and frequently contentious topic.

For the purposes of the graphs and charts in this thread, your undergrad school makes absolutely no difference. The numbers are straight from AMCAS verified GPAs.

As to whether it makes a difference to admissions committees... the best answer I can say is that it makes some difference but not near as much as you'd like it to make. In my medical school class, there are students from undergrads across the country. Try your best at whatever school you go to and do well on the MCAT
 
Hey man great data!


Are there any reliable resources to see the admit data besides MSAR for different types of degrees (MSAR kind of vague on their admitted class "degree" because i think this is referring to bachelor)? I just graduated this past summer in microbio and am now pursuing a cheap MBA at a local private school here in my city. I was wondering if there was any data showing if this is the right track? My app is pretty standard I mean I am 3.88/3.85sGPA and have the usual research, 300hrs+shadowing, 150+volunteering.
 
how important is the undergrad school . everyone talks about gpa, but what about the school that you got that gpa from. i.e. 3.5 from arizona state vs. duke? how do the medical schools evaluate this?

good. question.

i went to a top 10 undergrad and the curve was tough on me. i took a couple of classes during the summer at my state school and the curve was... well... a lot easier (speaking strictly science courses). i am hoping adcoms acknowledge this sort of thing, but from what i've read, they don't really. your raw GPA is really important, and it seems like its more important than where you might have gone to school. but i've never sat in on an adcom, so this is all hear-say/research/dread.
 
Does anyone know of any data regarding when applicants applied? According to this I have at least a 70% chance but considering I just got verified I feel like it goes down to 0% haha
 
Does anyone know of any data regarding when applicants applied? According to this I have at least a 70% chance but considering I just got verified I feel like it goes down to 0% haha
I think that the best resource I've seen is AMCAS's Twitter feed https://twitter.com/amcasinfo
They have provided periodic updates about the number of submitted apps. Most recent tweet from an hour ago was 42,135 submitted apps. 6 days ago it was 40,267. Should be winding down as they usually top out around 43k/44k
People submitting now are certainly way behind you since you were already verified
 
Top