
- Joined
- Jun 17, 2014
- Messages
- 63,099
- Reaction score
- 154,760
- Points
- 18,451
- Location
- Tot Chat
- Website
- forums.studentdoctor.net
LAST EDIT: 11/8/2015
So I decided to do something fun here.
This analysis report will focus on the famous LizzyM score and its role with the new 2015 MCAT.
Classical LizzyM Score
This is defined as LizzyM = 10*GPA + MCAT, where the GPA is out of a 4.0 scale and the MCAT is out of a 45 scale. Since the new MCAT is based on an entirely different scale (ranging from 472 to 528), the ideal and accurate approach is to use the AAMC Percentile Conversion Tables prepared by @efle.
After about few cycles (typically Class of 2022 and thereafter), the conversion tables lose much of their value as the old MCAT becomes obsolete. What happens to the LizzyM score?
WedgeDawg's Linear Extension Model
Developed by @WedgeDawg in Aug 2015 in the Continued Validity of LizzyM Scores thread, the proposed conversion is Score = 10*(GPA - 1) + (MCAT - 500). The model is called linear, since we are dealing with just basic addition and subtraction. WedgeDawg redefined the scoring system from the usual 85-point scale, to a new 58-point scale.
You can see his post described here (and in the above link):
Score-Mapping Model (via the Endpoint Method)
WedgeDawg's model is great and accurate, but it raises some questions and concerns. The most important involves changing the score range from 0 to 85 to -32 to 58, which seems difficult to switch and adjust after using the 0-85 scale for many years.
I propose an alternative, slightly more complicated model that addresses the above two concerns, while following the similar derivation approach to WedgeDawg's model. The model is generalized as:
Score = 10*GPA + (old MCAT range)/(new MCAT range) * (MCAT - lowest new MCAT score) (conversion formula)
This looks scary, so I will break it down:
new MCAT range = highest new MCAT score - lowest new MCAT score
old MCAT range = highest old MCAT score - lowest old MCAT score
The "new" and "old" terms are generalized and can be applied for any MCAT scale. For the 2015 MCAT, the model reduces to:
new MCAT range = 528 - 472 = 56
old MCAT range = 45 - 0 = 45
LizzyM = 10*GPA + (45/56) * (MCAT - 472) (LizzyM score for 2015 MCAT)
This model is also linear. The score becomes 0 for the lowest GPA and MCAT (0 and 472) and 85 for the highest GPA and MCAT (4 and 528), thus preserving the traditional LizzyM scoring range. Thus, the above model is MCAT-invariant. Likewise, the model prefers MCAT to GPA.
Equivalence of the Two Models and Complications
It's important to realize that WedgeDawg's model and the score-mapping model are really the same thing arranged differently. The equivalent relationship can be seen as follows:
So we algebraically rearranged the model to resemble WedgeDawg's model.
Despite the rearrangement, the model remains complex. It is difficult to deal with fractions and decimals through mental computations, and the point of the LizzyM scores is to be done easily without using a calculator. Fortunately, the model can be reduced to simple terms.
Simple Metrics and Index Shifting
We can further simplify the model at the expense of slightly increasing the score range from 0 to 85 to -8 to 88. Doing so will provide the following simple and effective formula called the WedgeDawg-Lawper metric.
Score = 10*(GPA + 2) + (MCAT - 500) = 10*GPA + (MCAT - 480)
We can also readily derive the simple metric through a procedure called index shifting. Note that the classical LizzyM score is defined as:
LizzyM = 10*GPA + MCAT (0 <= LizzyM <= 85)
The good news is that the 10*GPA term is standardized per AMCAS rules, so it is unlikely to change. The MCAT term changes from 0 to 45 to 472 to 528. This is readily adjusted for by the following simple formula
Score = 10*GPA + (MCAT - 472) (0 <= score <= 96)
Note that this is similar to the classical LizzyM score written as 10*GPA + (MCAT - 0). The boundaries are found by setting GPA = 0, MCAT = 472 and GPA = 4, MCAT = 528.
Calculations for some rearrangements and index shifting are then:
Score = 10*(GPA + 2) + (MCAT - 500) (-8 <= score <= 88)
So index shifting conserves the essential principles of simplicity and thoroughness by producing an easy metric with only a slightly expanded range.
Using the revised WedgeDawg-Lawper guidelines, we acquire the following:
Data Analysis
Now, everyone likes data, so I decided to provide the necessary tables. For simplicity, the GPA range used was from 3.0 to 4.0, and the MCAT range used was from 500 to 528. It follows by extension for rest of the values, but this is SDN, so everyone should be in this range 😉 😛
We can see from the above three tables that the score-mapping model isn't perfect, but the differences are mostly confined within <5% (the errors get worse for very low MCAT and GPA). The score-mapping model matches with the AAMC percentile data at average MCAT ranges (509-512) and at extremely high MCAT scores (>526).
Because the score-mapping model places a higher weight on the MCAT, it slightly punishes those with MCAT < 509, while slightly rewarding those with MCAT > 512. Much of the differences are addressed by AAMC's objective to de-emphasize the focus on the MCAT in favor of underlining the competency based requirements. For medical schools remain interested in numbers, the score-mapping model can be useful.
Also, below are the data tables of the simple metric.
I hope you find this new model to be interesting and helpful. Perhaps this new model is in fact inaccurate, but hey, it's fun exploring new possibilities.
Also, let me know if you find any mistakes here, and I will repair/reupload them.
The proposed new LizzyM-type score for the 2015 MCAT is:
Score = 10*(GPA + 2) + (MCAT - 500) (-8 <= score <= 88)
Score = 10*(GPA + 2) + (MCAT - 500) (-8 <= score <= 88)
So I decided to do something fun here.
This analysis report will focus on the famous LizzyM score and its role with the new 2015 MCAT.
Classical LizzyM Score
This is defined as LizzyM = 10*GPA + MCAT, where the GPA is out of a 4.0 scale and the MCAT is out of a 45 scale. Since the new MCAT is based on an entirely different scale (ranging from 472 to 528), the ideal and accurate approach is to use the AAMC Percentile Conversion Tables prepared by @efle.
After about few cycles (typically Class of 2022 and thereafter), the conversion tables lose much of their value as the old MCAT becomes obsolete. What happens to the LizzyM score?
WedgeDawg's Linear Extension Model
Developed by @WedgeDawg in Aug 2015 in the Continued Validity of LizzyM Scores thread, the proposed conversion is Score = 10*(GPA - 1) + (MCAT - 500). The model is called linear, since we are dealing with just basic addition and subtraction. WedgeDawg redefined the scoring system from the usual 85-point scale, to a new 58-point scale.
You can see his post described here (and in the above link):
Alright guys, I have a proposed conversion for you all. The formula is:
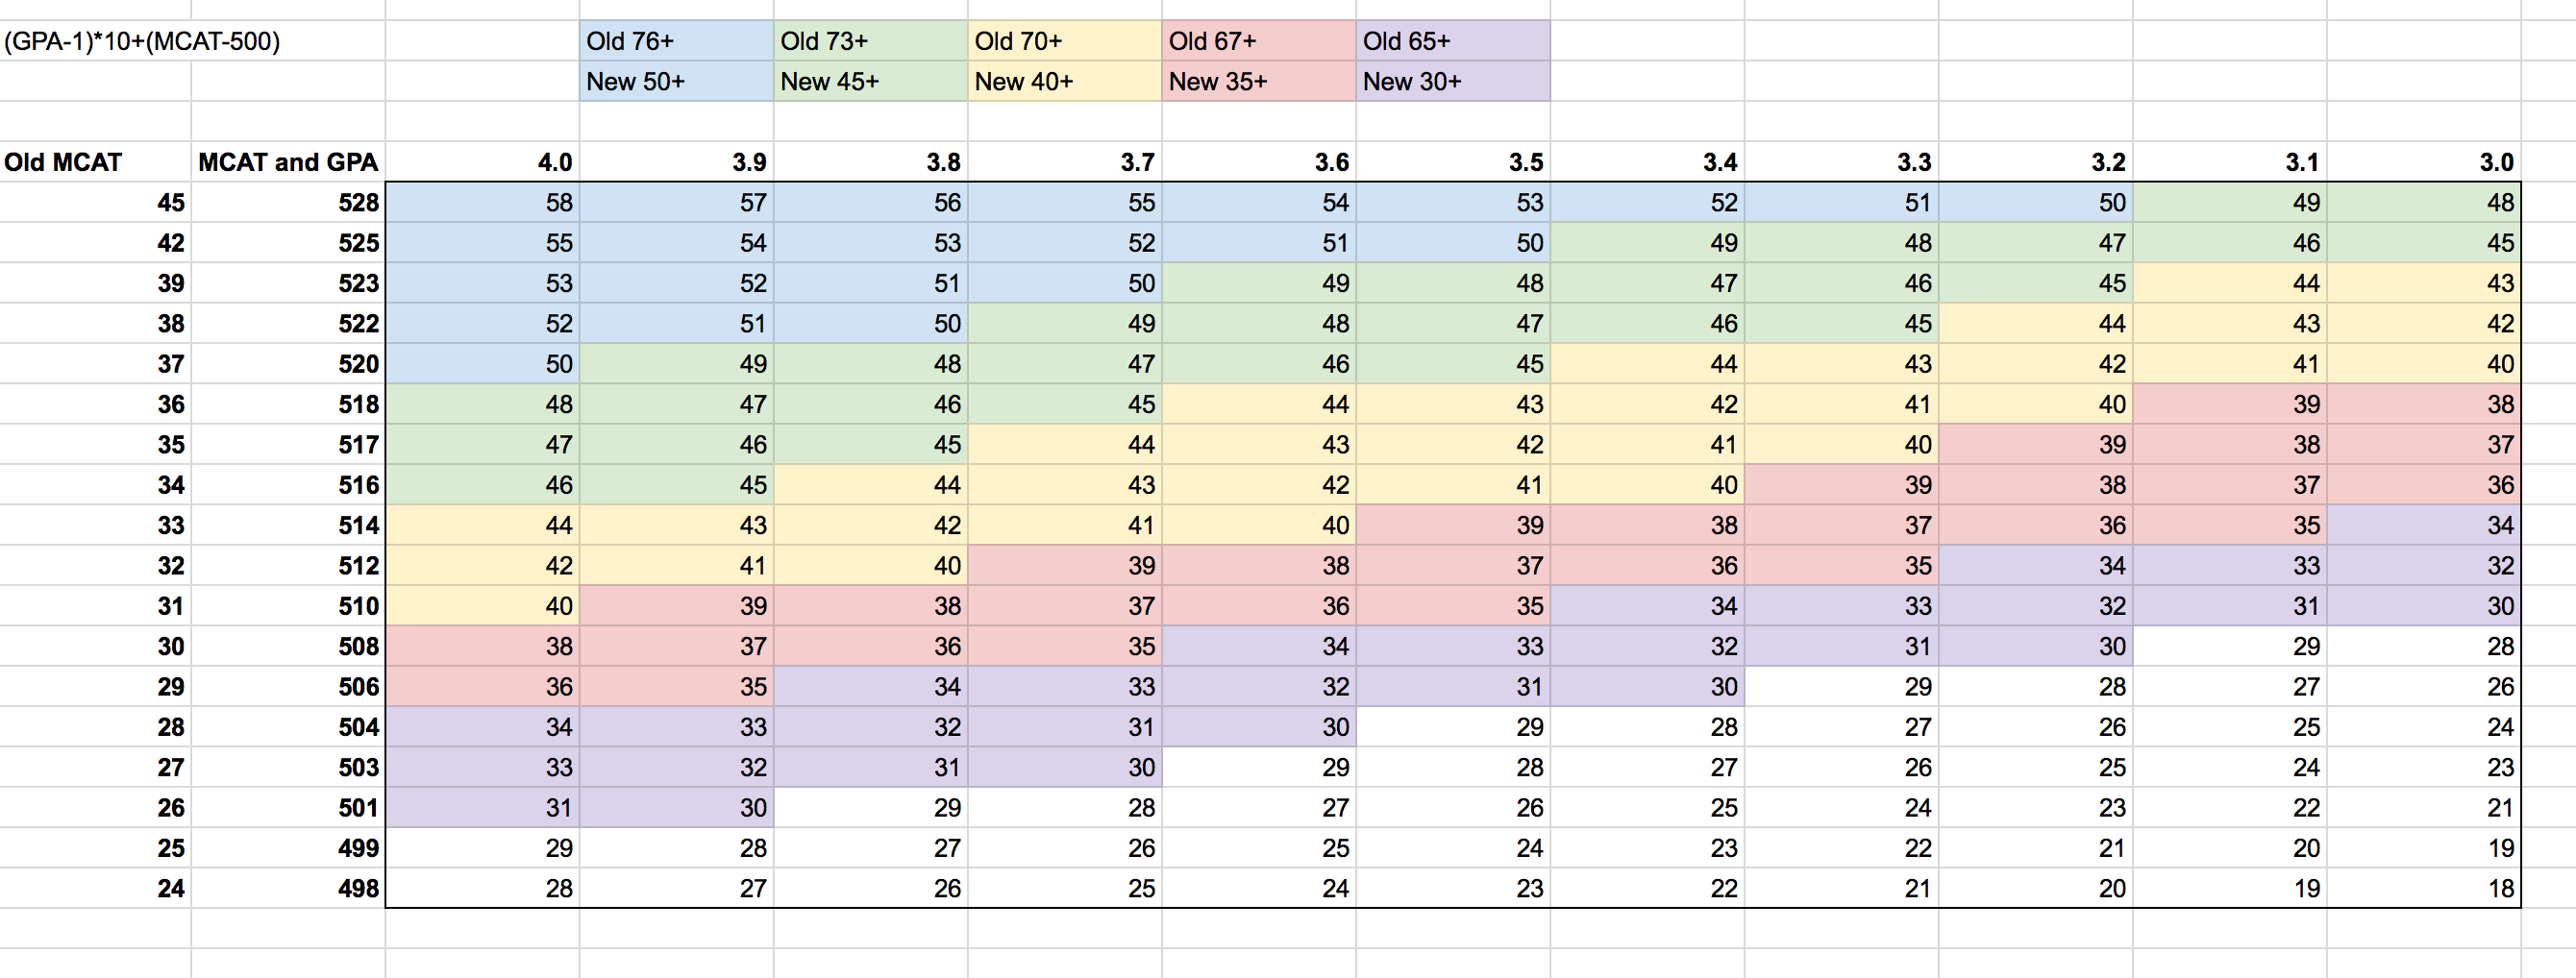
(GPA-1)*10 + (MCAT-500) = Score
The max score (4.0/528) comes out to 58. I've gone through and made correlates between the old LizzyM score and the new one (which can be seen in the chart below). Examples:
Old 76 (i.e. 3.8/38 or 3.9/37) is new 50. This is generally the number to shoot for for top schools.
Old 73 (i.e. 3.8/35 or 3.9/34) is new 45. This is generally a good number for mid tiers while possibly being competitive for some top tiers.
Old 70 (i.e. 3.7/33 or 3.9/31) is new 40. This is generally where a "competitive" applicant for med school falls around.
Old 67 (i.e. 3.6/31 or 3.7/30) is new 35. This is around the accepted applicant median.
Old 65 (i.e. 3.6/29 or 3.7/28) is new 30. This is highly competitive for DOs and marginal for MD.
I didn't continue my color coordination after this, but you get the idea.
This score not only is easy to calculate, but provides convenient benchmarks for comparing scores to old LizzyM scores (down by 5's from 50 for new, down by 3's from 76 for old). It does break down at the MCAT extremes, but so did the old score (45/3.1 still gave you 76, for example).
Here are some spot checks:
3.7/32 is 69 old, which should be around 39ish new. Formula gives, for 3.7/512, 39, spot on!
3.4/38 is 72 old, which should be around 43-44 new. Formula gives, for 3.4/522, 46, so it's a little high, but it's also an extreme MCAT place.
3.9/32 is 71 old, which should be around 41-42 new. Formula gives, for 3.9/512, 41, right on!
3.3/36 is 69 old, which should be about 38-39 new. Formula gives, for 3.3/518, 41, so again, a little high.
This seems to work best the more "matched" the GPA and MCAT are, and gives slight favor to higher MCAT scores at the opposing extremes, but overall should be a decent estimate.
Obviously you can make it more accurate (by doing exact percentile conversions), but that would inevitably take away the simplicity of the calculation, which is the whole point. Also, because the new MCAT has multiple scores per old MCAT score, you're going to be hard pressed to find an algorithm that perfectly fits everything.
As we move away from old MCAT scores entirely, the conversion factor equality becomes far less important, and the balance between MCAT and GPA becomes the most important thing (here GPA is weighted out of 30 while MCAT is weighted out of 28, and the overall score can go as low as -32 if you have a 468 MCAT and 0.00 GPA). One MCAT point is still equivalent to 0.1 GPA points, just like the old scale.
See what you guys think!
Score-Mapping Model (via the Endpoint Method)
WedgeDawg's model is great and accurate, but it raises some questions and concerns. The most important involves changing the score range from 0 to 85 to -32 to 58, which seems difficult to switch and adjust after using the 0-85 scale for many years.
I propose an alternative, slightly more complicated model that addresses the above two concerns, while following the similar derivation approach to WedgeDawg's model. The model is generalized as:
Score = 10*GPA + (old MCAT range)/(new MCAT range) * (MCAT - lowest new MCAT score) (conversion formula)
This looks scary, so I will break it down:
new MCAT range = highest new MCAT score - lowest new MCAT score
old MCAT range = highest old MCAT score - lowest old MCAT score
The "new" and "old" terms are generalized and can be applied for any MCAT scale. For the 2015 MCAT, the model reduces to:
new MCAT range = 528 - 472 = 56
old MCAT range = 45 - 0 = 45
LizzyM = 10*GPA + (45/56) * (MCAT - 472) (LizzyM score for 2015 MCAT)
This model is also linear. The score becomes 0 for the lowest GPA and MCAT (0 and 472) and 85 for the highest GPA and MCAT (4 and 528), thus preserving the traditional LizzyM scoring range. Thus, the above model is MCAT-invariant. Likewise, the model prefers MCAT to GPA.
Equivalence of the Two Models and Complications
It's important to realize that WedgeDawg's model and the score-mapping model are really the same thing arranged differently. The equivalent relationship can be seen as follows:
LizzyM = 10*GPA + (45/56) * (MCAT - 472) ==>
LizzyM = 10*GPA + (45/56) * (MCAT - 500 + 28) ==>
LizzyM = 10*GPA + (45/56) * (MCAT - 500) + (45/56)*28 ==>
LizzyM = 10*GPA + (45/56) * (MCAT - 500) + 45/2 ==>
LizzyM = 10*GPA + 0.8 * (MCAT - 500) + 22.5 ==> (since no one likes fractions)
LizzyM = (10*GPA + 22.5) + 0.8 * (MCAT - 500) ==>
LizzyM = 10*(GPA + 2.25) + 0.8 * (MCAT - 500)
So we algebraically rearranged the model to resemble WedgeDawg's model.
Despite the rearrangement, the model remains complex. It is difficult to deal with fractions and decimals through mental computations, and the point of the LizzyM scores is to be done easily without using a calculator. Fortunately, the model can be reduced to simple terms.
Simple Metrics and Index Shifting
We can further simplify the model at the expense of slightly increasing the score range from 0 to 85 to -8 to 88. Doing so will provide the following simple and effective formula called the WedgeDawg-Lawper metric.
Score = 10*(GPA + 2) + (MCAT - 500) = 10*GPA + (MCAT - 480)
We can also readily derive the simple metric through a procedure called index shifting. Note that the classical LizzyM score is defined as:
LizzyM = 10*GPA + MCAT (0 <= LizzyM <= 85)
The good news is that the 10*GPA term is standardized per AMCAS rules, so it is unlikely to change. The MCAT term changes from 0 to 45 to 472 to 528. This is readily adjusted for by the following simple formula
Score = 10*GPA + (MCAT - 472) (0 <= score <= 96)
Note that this is similar to the classical LizzyM score written as 10*GPA + (MCAT - 0). The boundaries are found by setting GPA = 0, MCAT = 472 and GPA = 4, MCAT = 528.
Calculations for some rearrangements and index shifting are then:
Score = 10*GPA + (MCAT - 472) (0 <= score <= 96) ==>
Score = 10*GPA + (MCAT - 500 + 28) (0<= score <= 96) ==>
Score = (10*GPA + 28) + (MCAT - 500) (0 <= score <= 96) ==>
Score = 10*(GPA + 2.8) + (MCAT - 500) (0 <= score <= 96) ==>
Score = 10*(GPA + 2.8 - 0.8) + (MCAT - 500) (0-10*0.8 <= score <= 96-10*0.8) ==>
Score = 10*(GPA + 2) + (MCAT - 500) (-8 <= score <= 88)
Score = 10*(GPA + 2) + (MCAT - 500) (-8 <= score <= 88)
So index shifting conserves the essential principles of simplicity and thoroughness by producing an easy metric with only a slightly expanded range.
Using the revised WedgeDawg-Lawper guidelines, we acquire the following:
Old 76 (i.e. 3.8/38 or 3.9/37) is new 80. This is generally the number to shoot for for top schools.
Old 73 (i.e. 3.8/35 or 3.9/34) is new 75. This is generally a good number for mid tiers while possibly being competitive for some top tiers.
Old 70 (i.e. 3.7/33 or 3.9/31) is new 70. This is generally where a "competitive" applicant for med school falls around.
Old 67 (i.e. 3.6/31 or 3.7/30) is new 65. This is around the accepted applicant median.
Old 65 (i.e. 3.6/29 or 3.7/28) is new 60. This is highly competitive for DOs and marginal for MD.
Data Analysis
Now, everyone likes data, so I decided to provide the necessary tables. For simplicity, the GPA range used was from 3.0 to 4.0, and the MCAT range used was from 500 to 528. It follows by extension for rest of the values, but this is SDN, so everyone should be in this range 😉 😛
Score-Mapping Model Table

AAMC Percentile Conversion Table

Percent Error Table

AAMC Percentile Conversion Table
Percent Error Table
We can see from the above three tables that the score-mapping model isn't perfect, but the differences are mostly confined within <5% (the errors get worse for very low MCAT and GPA). The score-mapping model matches with the AAMC percentile data at average MCAT ranges (509-512) and at extremely high MCAT scores (>526).
Because the score-mapping model places a higher weight on the MCAT, it slightly punishes those with MCAT < 509, while slightly rewarding those with MCAT > 512. Much of the differences are addressed by AAMC's objective to de-emphasize the focus on the MCAT in favor of underlining the competency based requirements. For medical schools remain interested in numbers, the score-mapping model can be useful.
Also, below are the data tables of the simple metric.
WedgeDawg-Lawper Metric Table

Percent Error Table

Percent Error Table
I hope you find this new model to be interesting and helpful. Perhaps this new model is in fact inaccurate, but hey, it's fun exploring new possibilities.
Also, let me know if you find any mistakes here, and I will repair/reupload them.
Last edited:
