Advertisement - Members don't see this ad
Hi all, so I noticed that "pearson correlation coefficients" are in FA. I got this q and need some help. Can anyone just explain the concepts we gotta know for step 1 in layman term? Also, if you could help me with this q, I would really appreciate it. Thank you.
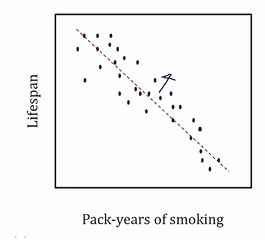
An investigator is evaluating the health benefits of daily activity with use of the Minnesota Activity Survey (MAS). The MAS yields a score ranging from 100 to 0, with 100 indicating the highest activity level and 0 indicating the lowest. One such study shows MAS values compared with age and weight obtained during the routine health maintenance examinations. The results of this study are shown as Pearson correlation coefficients: (see the attached image)
Based on the data shown, which of the following is the most appropriate conclustion?
A. Age and weight are positively correlated
B. Age is a stronger predictor of MAS than is weight
C. Both age and weight are associated with activity level
D. Higher daily activity levels lead to reduced weight
E. The relationship of age to MAS is best conceptualized as linear