
- Joined
- Apr 6, 2014
- Messages
- 14,146
- Reaction score
- 22,795
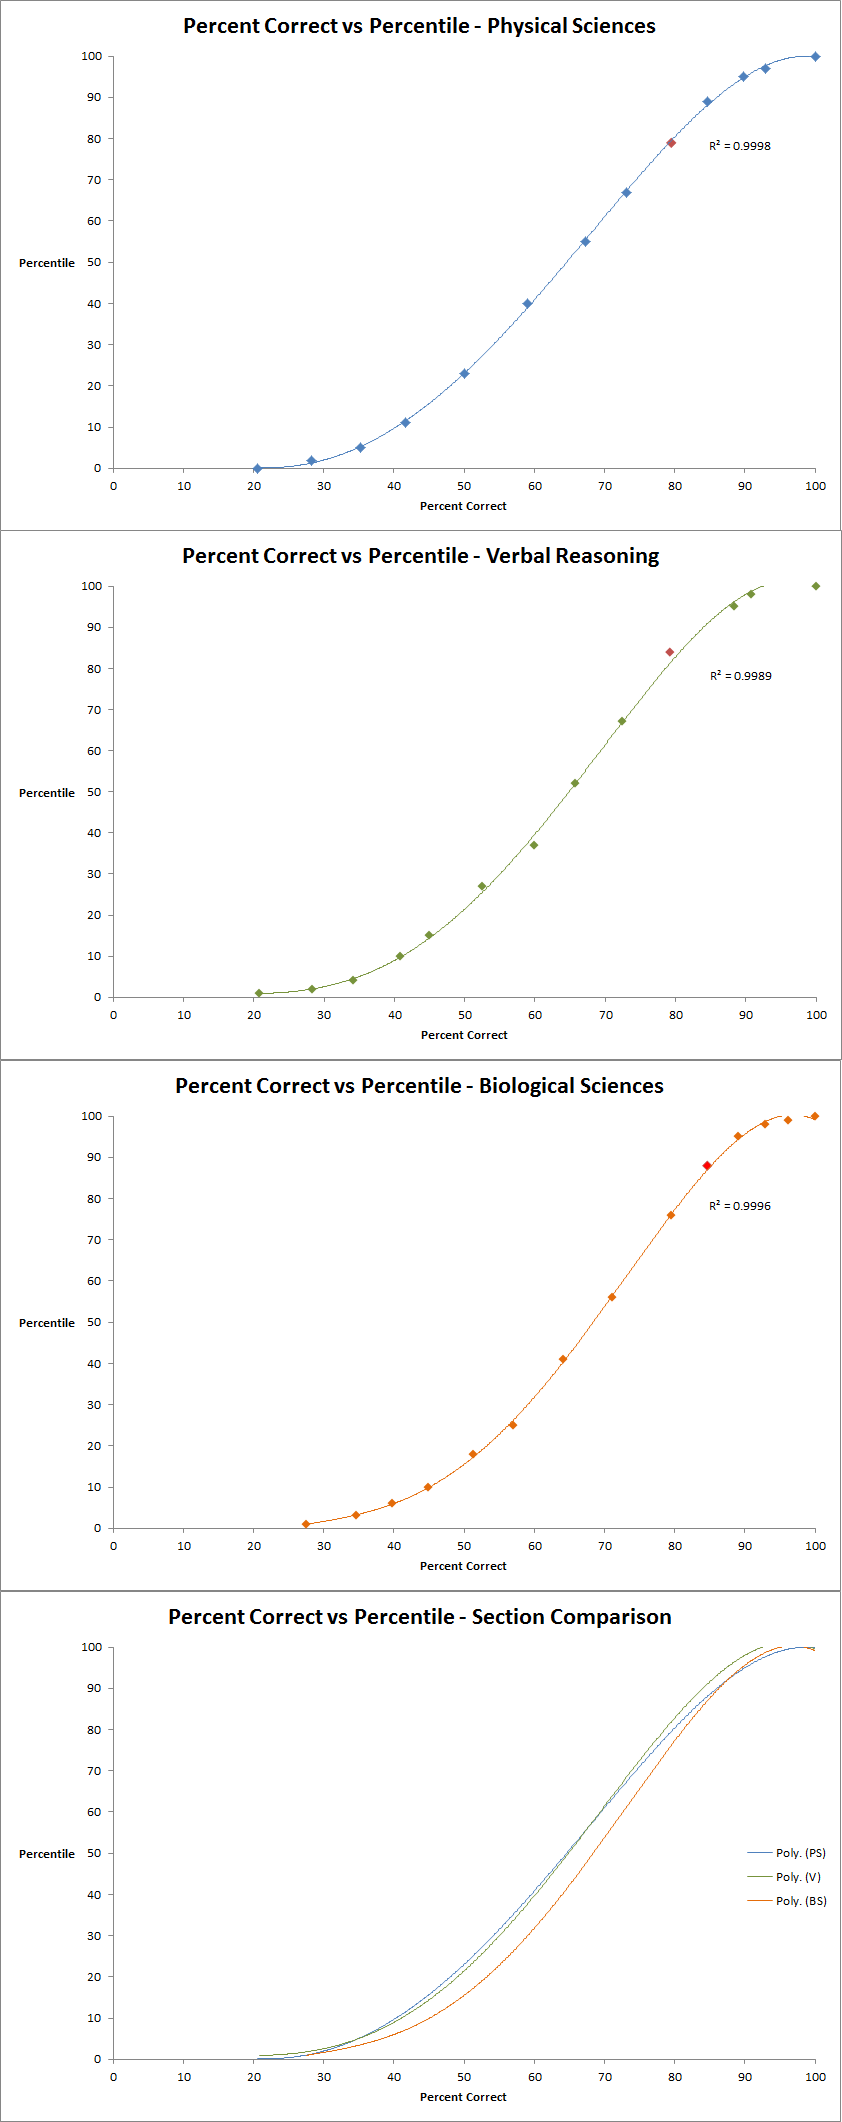
I was always curious about the relationship between number of correct answers and resulting score percentiles. So I decided to go ahead and plot it out when I saw someone asking about it earlier in a thread.
The charts are built using the scoring scales for AAMC Official Practice Tests 9, 10, and 11 plus the Final Percentile Ranks for the old MCAT.
Method: Since percentiles listed in the AAMC ranks are the ceilings of percentile bins, I paired to the highest number in the bins of correct answers possible to earn a score (averaged across the three tests). I know that's confusing, so...
For example, in PS the numbers correct (out of 52) for a section score of 13 were 47-48, 49-49, and 47-48 across Practice Tests 9, 10 and 11 respectively. I averaged the 48, 49, and 48 and converted into percentage to get 93% correct answers. Paired with a 13 being 97th percentile, this appears on the PS chart as the point at (93, 97).
Points appearing in red mark the boundary beyond which the percentile values become higher than the percent correct (such as the 93, 97 pair). For all points before the red one, the percent correct is a higher value than percentile. For all charts the trendline is polynomial to the 4th power.
Here's my excel file for putting this together. Let me know any questions or mistakes. If the same number correct to section score conversion data becomes available for the MCAT 2015, please PM me! I'd love to chart that out as well to see if you need more or less correct answers for an equivalent percentile between the old and new MCATs.
It's interesting to note that Bio demands more correct answers to earn a similar percentile to PS or V!
Charts: