
- Joined
- Dec 1, 2011
- Messages
- 18,577
- Reaction score
- 57
This is from NOVA Physics. I don't understand what the text outside of the box means.
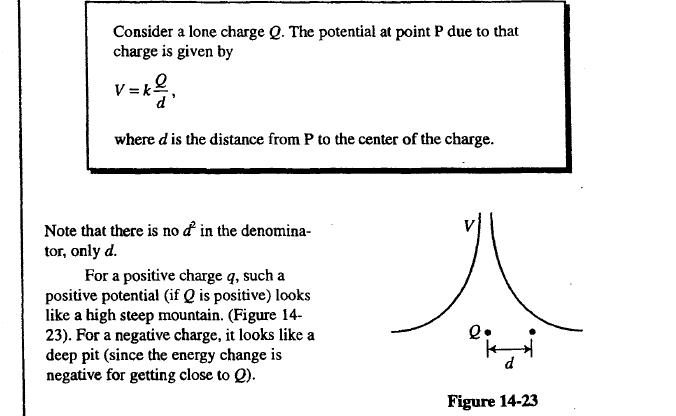
Is it saying that as a charge q approaches a different charge Q, that graph represents the energy needed as distance, d, decreases? Is this graph showing the energy only for a positive charge q in an area with positive potential Q?
Also, V is electric potential right? And as you decrease the distance from charge Q, the potential increases? How does figure 14-23 show the value of V? For instance, looking only at the line on the left, the distance from Q is about the same at both endpoints of the line, so does that mean the potential is the same at those two points? Does the end point nearer the top of the figure have a greater potential than the end point nearer to the left side of the figure?
http://imgur.com/iTT6n
Last edited: