Help in research lab

This forum made possible through the generous support of SDN members, donors, and sponsors. Thank you.

BeastfromthEast

Full Member
10+ Year Member
Joined
Apr 26, 2010
Messages
218
Reaction score
0
In the lab where I do research, I do enzyme assays. In a nutshell, I am testing various inhibitors on proteins. We are testing inhibitors for a protein necessary for a parasite that causes Chaga's disease to live.

So my part is to test it on the human enzyme and see which one inhibits it the least, while my partner is testing it on the parasite enzyme, looking for one that inhibits it the most.

The problem is that we are both getting inconsistent results. My controls, despite me being very very careful, are not consistent. It may have to do with the activity of the enzyme (since it is kept in the freezer, I take it out and thaw it in ice. Perhaps I have to thaw it longer even though it is clearly thawed out?).

We are trying to find the Ki (forgot what it stands for) of the inhibitors using a Lineweaver Burk plot. But the thing is my PI is getting frustrated (when I plotted my points they didn't align well linearly). The reaction rate is supposed to decrease linearly as more inhibitor is added. He said to me that if I can't figure out what is going on, he's gonna give up on trying to find the Ki and do something simpler. But the thing was he told me before he was planning on publishing the Ki data :(

So what should I do? I'm being careful as it is. Since we use very small amounts of protein (~1 microliter), we tried diluting it five fold and then using five microliters of the dilution to minimize error from extra protein sticking on the pipette tip, but still not consistent.

I'm not sure if I put this in the right forum, but can anyone with experience doing enzyme assays and troubleshooting help me out here? I've been working on this since June and I really would like to get this Ki done. Thanks!

Members don't see this ad.
 
Unfortunately I don't have any experience with enzyme assays. Have you considered doing an exhaustive lit search to see if there are any glaring disparities between your current protocol and one of a related group?
 
In the lab where I do research, I do enzyme assays. In a nutshell, I am testing various inhibitors on proteins. We are testing inhibitors for a protein necessary for a parasite that causes Chaga's disease to live.

So my part is to test it on the human enzyme and see which one inhibits it the least, while my partner is testing it on the parasite enzyme, looking for one that inhibits it the most.

The problem is that we are both getting inconsistent results. My controls, despite me being very very careful, are not consistent. It may have to do with the activity of the enzyme (since it is kept in the freezer, I take it out and thaw it in ice. Perhaps I have to thaw it longer even though it is clearly thawed out?).

We are trying to find the Ki (forgot what it stands for) of the inhibitors using a Lineweaver Burk plot. But the thing is my PI is getting frustrated (when I plotted my points they didn't align well linearly). The reaction rate is supposed to decrease linearly as more inhibitor is added. He said to me that if I can't figure out what is going on, he's gonna give up on trying to find the Ki and do something simpler. But the thing was he told me before he was planning on publishing the Ki data :(

So what should I do? I'm being careful as it is. Since we use very small amounts of protein (~1 microliter), we tried diluting it five fold and then using five microliters of the dilution to minimize error from extra protein sticking on the pipette tip, but still not consistent.

I'm not sure if I put this in the right forum, but can anyone with experience doing enzyme assays and troubleshooting help me out here? I've been working on this since June and I really would like to get this Ki done. Thanks!

Do NOT thaw it for longer. Minimize the amount of time your enzyme spends outside of the freezer. Actually this goes with anything that's frozen.

It would be really impossible to troubleshoot this without specific info about your assays. Has anyone else in your lab worked with this specific assay before? What is their usual margin of error (i.e. how technique-sensitive is it)? Do you get consistent enzyme activity in absence of the inhibitor? (That should tell you whether the problem is in the enzyme or in the inhibitor, hopefully.) Did your lab recently calibrate your pipettes? If the protocol is repeated by someone else every step of the way, is it still inconsistent to the same degree? Is there any way you can use your assay protocol on a particular enzyme-inhibitor pair that you already have data for, to see whether the problem lies in the protocol or in the specific substances you're testing? Have you checked every possible source of contamination?

I once had to do a 6-dimensional assay to find the only combination that worked, in the most ghetto way possible (96 wells all with different combinations of variables), so I know that research can be frustrating. Just make sure that you test everything one variable at a time so you can at least narrow down the scope of your problems.

Edit: So I went back and read more of your post. I have REALLY limited knowledge about biochemistry so sorry if this is stupid, but sometimes... your PI is wrong. Are you really sure that your inhibitor is completely reversible? (I kind of recall these graphs being usually used for reversible inhibitors...) Definitely check out the background literature... Just because your data doesn't fit your predicted values doesn't mean it's necessarily a methodological problem. Data is data and maybe it's telling something unexpected.
 
Last edited:
Members don't see this ad :)
Oh, you guys and your assays. :( Why can't I do something fun like that in my lab.
 
It may have to do with the activity of the enzyme (since it is kept in the freezer, I take it out and thaw it in ice. Perhaps I have to thaw it longer even though it is clearly thawed out?).

...

So what should I do? I'm being careful as it is. Since we use very small amounts of protein (~1 microliter), we tried diluting it five fold and then using five microliters of the dilution to minimize error from extra protein sticking on the pipette tip, but still not consistent.

are you sure the enzyme is frozen? i've never done the type of assay you are doing, but all the enzymes i've ever dealt with are diluted in a glycerol medium, so they DO NOT freeze at -20 deg C. dealing with these, you take them from the freezer in some kind of ice block holding tray, use it as quickly as possible, and put it right back into the freezer. if you've been putting the enzymes through many warming/cooling cycles it could be inactive/partially denatured now. it could also just be bad/old anyway.

in fact, any one of your reagents could be bad/old, or maybe one or more of your calculations/measurements are off.

this is why working in a lab can be frustrating. you have to double and triple check everything. maybe ask someone else to check your work too. and even if you're doing everything right, the reagents/kit could just suck.
 
Last edited:
In the lab where I do research, I do enzyme assays. In a nutshell, I am testing various inhibitors on proteins. We are testing inhibitors for a protein necessary for a parasite that causes Chaga's disease to live.

So my part is to test it on the human enzyme and see which one inhibits it the least, while my partner is testing it on the parasite enzyme, looking for one that inhibits it the most.

The problem is that we are both getting inconsistent results. My controls, despite me being very very careful, are not consistent. It may have to do with the activity of the enzyme (since it is kept in the freezer, I take it out and thaw it in ice. Perhaps I have to thaw it longer even though it is clearly thawed out?).

We are trying to find the Ki (forgot what it stands for) of the inhibitors using a Lineweaver Burk plot. But the thing is my PI is getting frustrated (when I plotted my points they didn't align well linearly). The reaction rate is supposed to decrease linearly as more inhibitor is added. He said to me that if I can't figure out what is going on, he's gonna give up on trying to find the Ki and do something simpler. But the thing was he told me before he was planning on publishing the Ki data :(

So what should I do? I'm being careful as it is. Since we use very small amounts of protein (~1 microliter), we tried diluting it five fold and then using five microliters of the dilution to minimize error from extra protein sticking on the pipette tip, but still not consistent.

I'm not sure if I put this in the right forum, but can anyone with experience doing enzyme assays and troubleshooting help me out here? I've been working on this since June and I really would like to get this Ki done. Thanks!

Zoom out more.

Also, make sure you're working on a FLAT surface.

I once put an ELISA plate on an ever so slightly angled surface...
 
Firstly, I am also working on Chagas' disease so :) but I do more transmission control work.

Secondly, about the enzyme part - I agree with the people who said you shouldn't be thawing your enzyme. If you buy enzymes from AbCam, Sigma, Santa Cruz etc, they are in a glycerol medium that doesn't freeze at -20C. Make sure you are storing it correctly. Reduce the time you keep it outside. Get one of those freeze boxes that will keep your enzymes at -20 when you take it out. You shouldn't have to thaw it out.

So about trouble shooting, you might want to buy a new batch of enzymes. Considering you have left it outside for a long period of time, I would say that the enzyme you have is degraded.

Also, are you following an established protocol or is this something you/the lab developed? If so, make sure your experimental set up follows the assumptions made in enzyme kinetics for you to do Lineweaver Burke plot (Concentration of substrate >> concentration of enzyme, etc etc etc..) Use lot of the substrate and less of the enzyme - a basic rule of thumb you might wanna look at is that enzyme should only be around 10% of the total volume of the reaction.

Are your experiments being run at the ideal temperature for the enzyme (37C vs room temp etc?). Also, I agree with Ponyo about investigating what type of inhibitor it is.

But the fact is, without more information, there is no way we can say anything.

Just a tip: Microliters don't help in anything when it comes to lab work - moles and molar concentrations are the way to go.
 
The Lineweaver Burk is helpful when you are working in changes on magnitude scales. It's not useful for changes within a single significant digit, which is probably why your line isn't straight (or you're not doing the regression with enough significant and uniform data points).

Remember, it's 1/Vmax versus 1/, both of which are hyperbolic functions translated into straight lines (also, it crosses the X axis at -1/Km). You MAY have an easier time making a regression line of Vmax versus and graphing that hyperbolic function as it should look.

Pipetting can cause errors too. That's why enzyme assays are so freaking annoying. When I really want a number, I do ELISA and spectrophotometry (rather than something silly like time or cell count). Make sure that whatever method you use to analyze "activity", it's standard.
 
Just echoing other responses.

You shouldn't have to really thaw the enzyme - check out the enzyme details. For example, some enzymes are their most efficient near room temp and can easily denature if warmer. So make sure the temperature you are conducting the experiment at works with the enzyme's activity.

Agreement on verifying the inhibitor's action.

Agreement on reading the literature - actually, I hope that's what you did before you came to SDN to ask this. See if other people had issues with the enzyme working.

Verify the age of enzyme and additional reagents - also verify they aren't contaminated.

You may need to use different vols/conc of enzyme, also the amounts of substrate or inhibitor may need to be altered.

Lastly, welcome to science. It's rare it works exactly how you want it to. And if it did, you might want to question why.
 
alright thanks for all the responses!

I should have clarified about the enzyme. It is stored a freezer. It is frozen solid. When I do my enzyme assays, I take it out and thaw it in a tub of ice.

Also I probably should have mentioned that yes I do use a spectrophotomer (is that how I spell it?) to measure the rate of reaction.

Currently, the concentrations of the substrate in the total solution is approximately 40, 50, and 60 nanomolar. Idk what the concentration of the enzyme is. The concentration of the cofactor (NADPH) is 50 nmolar.

Basically in the reaction, the NADPH is oxidized to NADP+, and when this happens, absorbance decreases. The rate at which the abosrbance deceases is measured.

Yes, during the assay I incubate everything in a cuvette (before adding the substrate which would start the reaction) at the optimal temperature of the enzyme (assuming my PI is correct, 30 degrees C).

The techniques we use seem to be correct because previously they were able to get a Lineweaver Burk plot that had the points align almost to the lines (unlike my data :() They were able to publish the data.

Argg I feel frustrated. I don't feel comfortable questioning his methods. He is a really good PI. I actually do productive things, but he seems frustrated at me.
 
Last edited:
alright thanks for all the responses!

I should have clarified about the enzyme. It is stored a freezer. It is frozen solid. When I do my enzyme assays, I take it out and thaw it in a tub of ice.

Also I probably should have mentioned that yes I do use a spectrophotomer (is that how I spell it?) to measure the rate of reaction.

Currently, the concentrations of the substrate in the total solution is approximately 40, 50, and 60 nanomolar. Idk what the concentration of the enzyme is. The concentration of the cofactor (NADPH) is 50 nmolar.

Basically in the reaction, the NADPH is oxidized to NADP+, and when this happens, absorbance decreases. The rate at which the abosrbance deceases is measured.

Yes, during the assay I incubate everything in a cuvette (before adding the substrate which would start the reaction) at the optimal temperature of the enzyme (assuming my PI is correct, 30 degrees C).

The techniques we use seem to be correct because previously they were able to get a Lineweaver Burk plot that had the points align almost to the lines (unlike my data :() They were able to publish the data.

Argg I feel frustrated. I don't feel comfortable questioning his methods. He is a really good PI. I actually do productive things, but he seems frustrated at me.

Is your inhibitor stable? How do yo dilute it? I'd say either freeze/thaws are denaturing the enzyme or your inhibitor is either being diluted inconsistently or going bad. Serial dilutions are super important for a good curve.
 
hmm well idk much about the stability of the inhibitor. We keep it at room temperature, so I assume it is stable in those conditions. I am doing what he wants me to (previously they got published, so I think he knows what he is doing).

about the serial dilutions... i dont think we have done that. when i made different concentrations of inhibitors, I just use M1V1=M2V2. what advantages does serial dilutions have over mv (forgive my ignorance)? For half of the concentration I made them myself while the other half he diluted them (I don;t think he serial diluted). Both show inconsistencies.

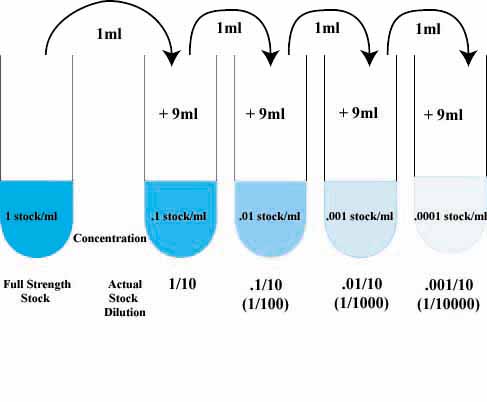
Serial dilutions are the best way to be consistent. For example, you make the highest concentration first. Then, let's say you dilute that 1:10. Take the 1:10 and dilute it again 1:10. So now you have a 1:1, 1:10, and 1:100. Only dilute a portion of each concentration so you have some volume to use at each dilution. This way you only measure the inhibitor once.

serial%20dilution.jpg
 
Serial dilution is for going down a log scale of concentrations. If you're NOT going down a log (or x10) scale, there's no need for serial dilution.

I assume you have an excess of enzymes. I hope the enzymes are free-floating.

Therefore, you're seeing which [inhibitor] produces which [NADP+] from NADPH.

Since enzymes take time to work, perhaps you need to normalize time or let them all reach Vmax.

Other than that it's a matter of quality control: don't reuse pipettes, don't reuse cuvettes, calibrate the spectrophotometer, add substrates to reaction vessel sequentially, and then stop the reaction (or measure them) in the same sequence.

Now that I think about it...

I'm not sure why you expect different inhibitors to be on the same Lineweaver Burk plot. The LB plot is for different CONCENTRATIONS of the same enzyme-substrate interaction. These concentrations are hopefully taken from the same source so that serial dilutions or multiple mv dilutions are guaranteed to have the same starting concentration. If you substitute a different enzyme-substrate complex, Km is going to change... a changing Km leads to a different LB line (depending on affinity). If the inhibitor changes the actual mechanism of the enzyme, Vmax itself will change along with Km, and then not only will your x-intercept (-1/Km) change, but your slope will change also.
 
well in the lb plot, each line represents a certain concentration of inhibitor.
so there are multiple lines. we are also varying the amount of substrate as well to determine the Ki. I'm not sure if that clarifies anything lol

In the previous pub, all the points were very close to the line it corresponded to.
For me, the line is like an average of my points, which my PI does not like

On a LB plot, each POINT is a concentration of SUBSTRATE, which gives a reaction velocity of that enzyme-substrate interaction under influence of a single concentration of inhibitor. Each LINE represents a single enzyme-substrate range of reaction velocities under 1 single concentration of inhibitor, comprising of multiple POINTS which correlate to different [substrate] and different reaction velocities. Where it crosses the y-axis is the 1/Vmax. Where it crosses the x-axis is the -1/Km.

It sounds like you have it right (I thought you only wanted 1 LB plot), but you just need more... quality control. Lol. Nobody will be better to tell you where things went wrong than yourself. Just make sure, like I said, that the concentrations are what they should be, and that the vessels have the same time to carry out their reactions.
 
Serial dilution is for going down a log scale of concentrations. If you're NOT going down a log (or x10) scale, there's no need for serial dilution.

It doesn't have to be log10. It could be any factor. I do alot of 1:2 serials. I just feel like it is more accurate than pulling from your stock each time.

And yes on the quality control stuff. Change your tips.
 
ohh ok. yeah i do serial dilutions, just not in log10. the stuff is already serial diluted by him anyway; im just using them to make more specific concentraions.

yes, i always change my pipette tips haha. man this is frustrating.
 
Perhaps you could do a statistical analysis and see if the non-linear deviations are statistically significant...
 
Top