Methods
Sources: The main sources are
"Table 24: MCAT and GPA Grid for Applicants and Acceptees to U.S. Medical Schools, 2009-2011 (aggregated)" and
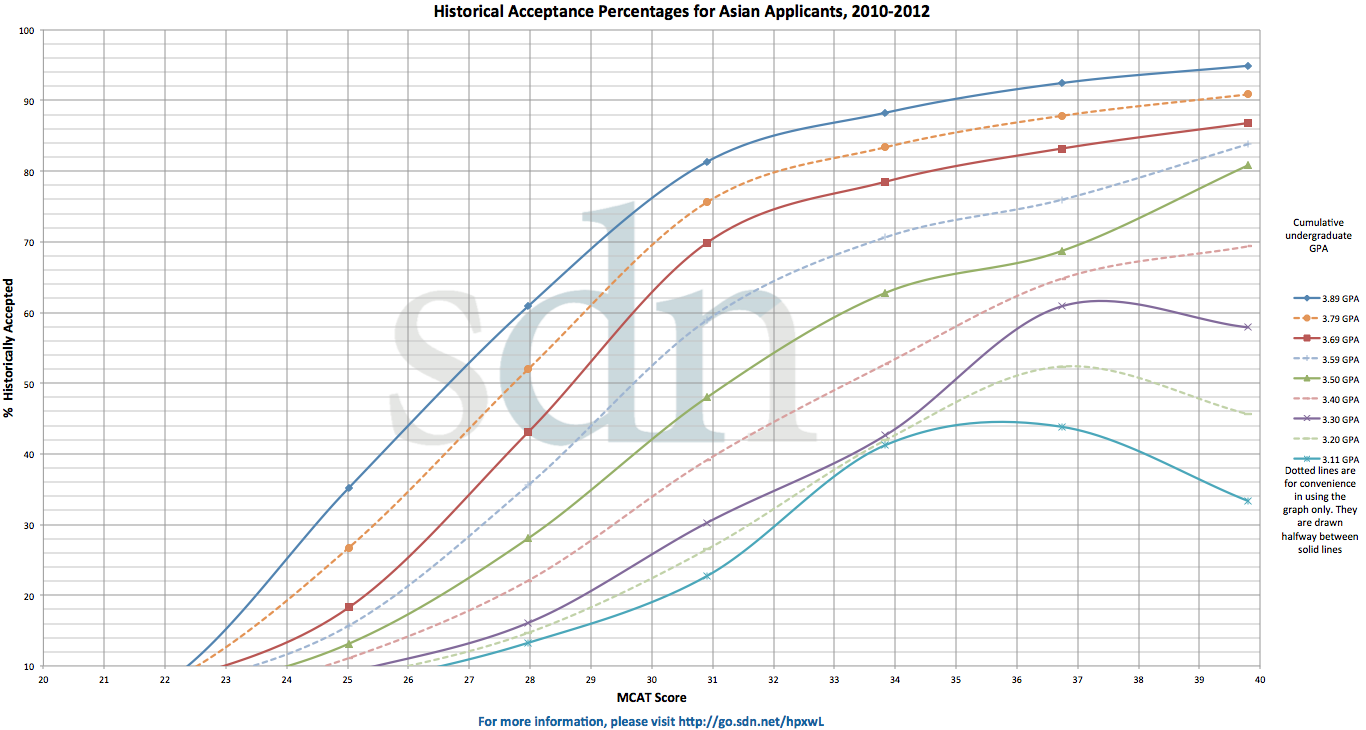
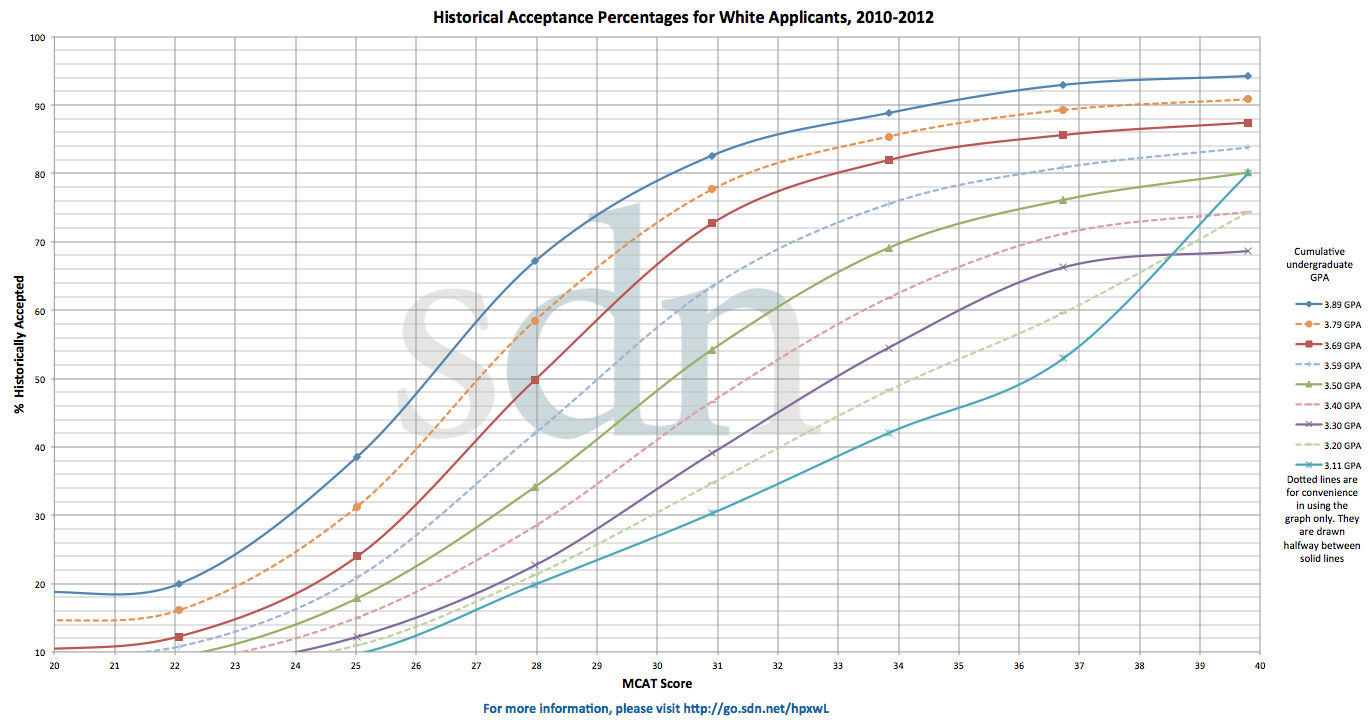
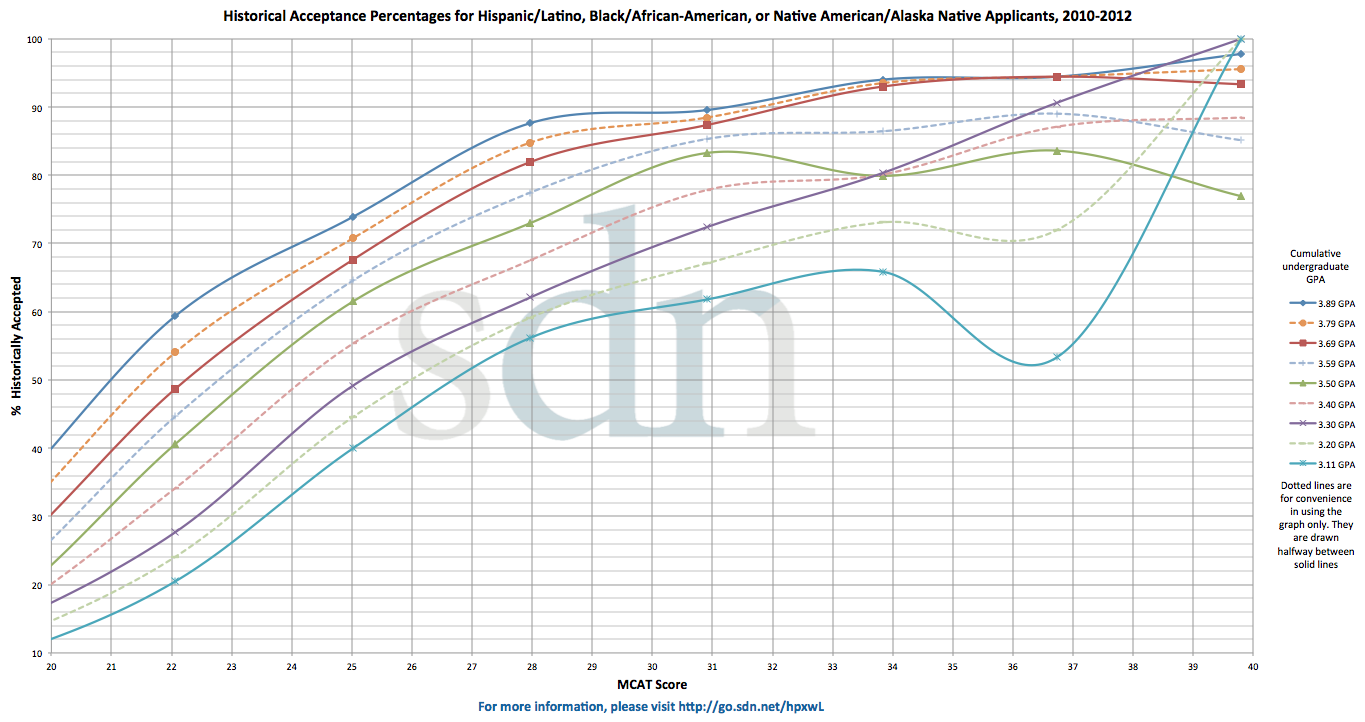
"Table 25: MCAT and GPA Grid for Applicants and Acceptees by Selected Race and Ethnicity, 2009-2011 (aggregated)" from the AAMC. I also used data from the
2009, 2010, and 2011 MCAT examinee statistics and from
"Table 17: MCAT Scores and GPAs for Applicants and Matriculants to U.S. Medical Schools, 2000-2011". All data is copyrighted by AAMC and is used for educational, noncommercial purposes.
GPA component: The GPA component is a skewed GPA based on a normal distribution of GPAs. I used the mean and standard deviation for 2009, 2010, and 2011 applicants listed in Table 17 to approximate the real average for each bin. AMCAS publishes a graph in the print edition of the MSAR (the MSAR is a highly recommended resource for additional information on applications and medical schools, with ordering information
available here), but they do not publish raw numbers. Based on the data published for free by AMCAS, it is impossible to fine-tune the GPA calculation any further than using the median and SD.
MCAT component: The MCAT score for each data point is also skewed. The 2009, 2010, and 2011 MCAT examinee table gives the "percent achieving score" for every possible MCAT score. Since the mode of all scores is a 27 and the distribution is close to normal, the percent achieving each score gets lower as you move away from the mode. I decided to stick with the examinee statistics rather than the applicant statistics because the only data available is mean and SD, whereas the examinee stats are more detailed.
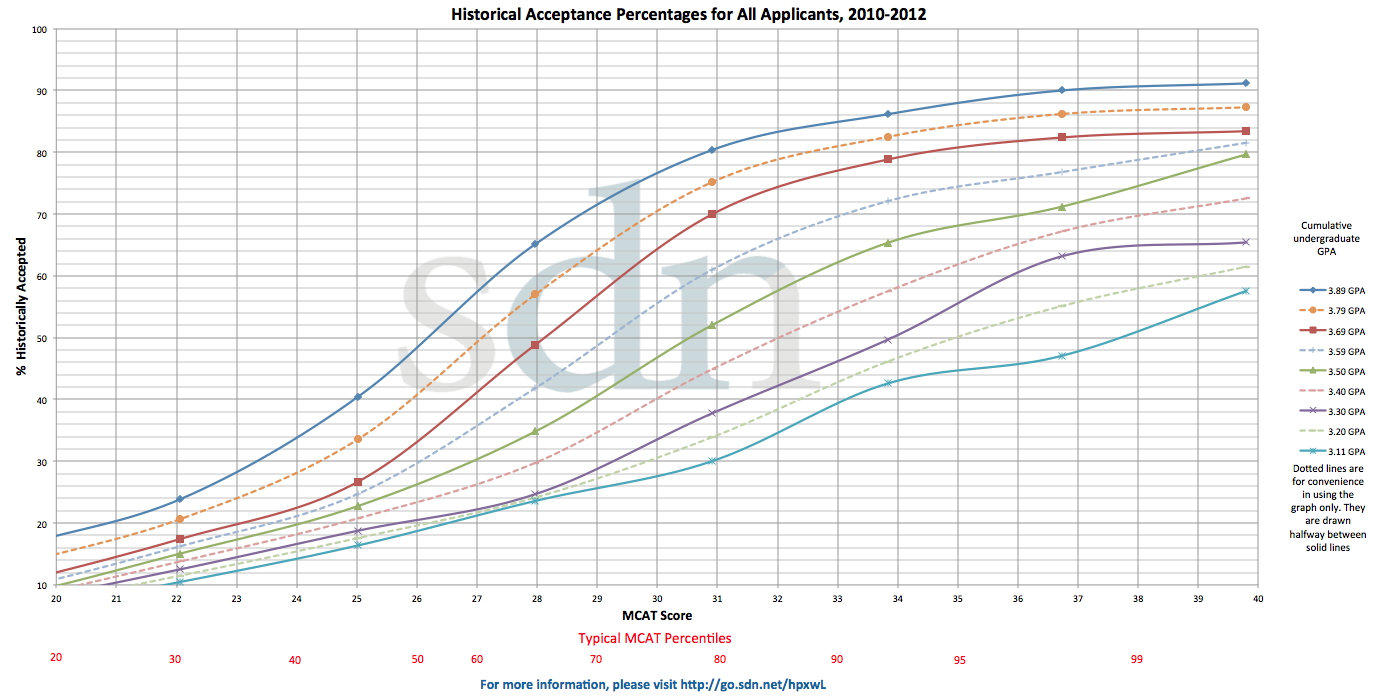
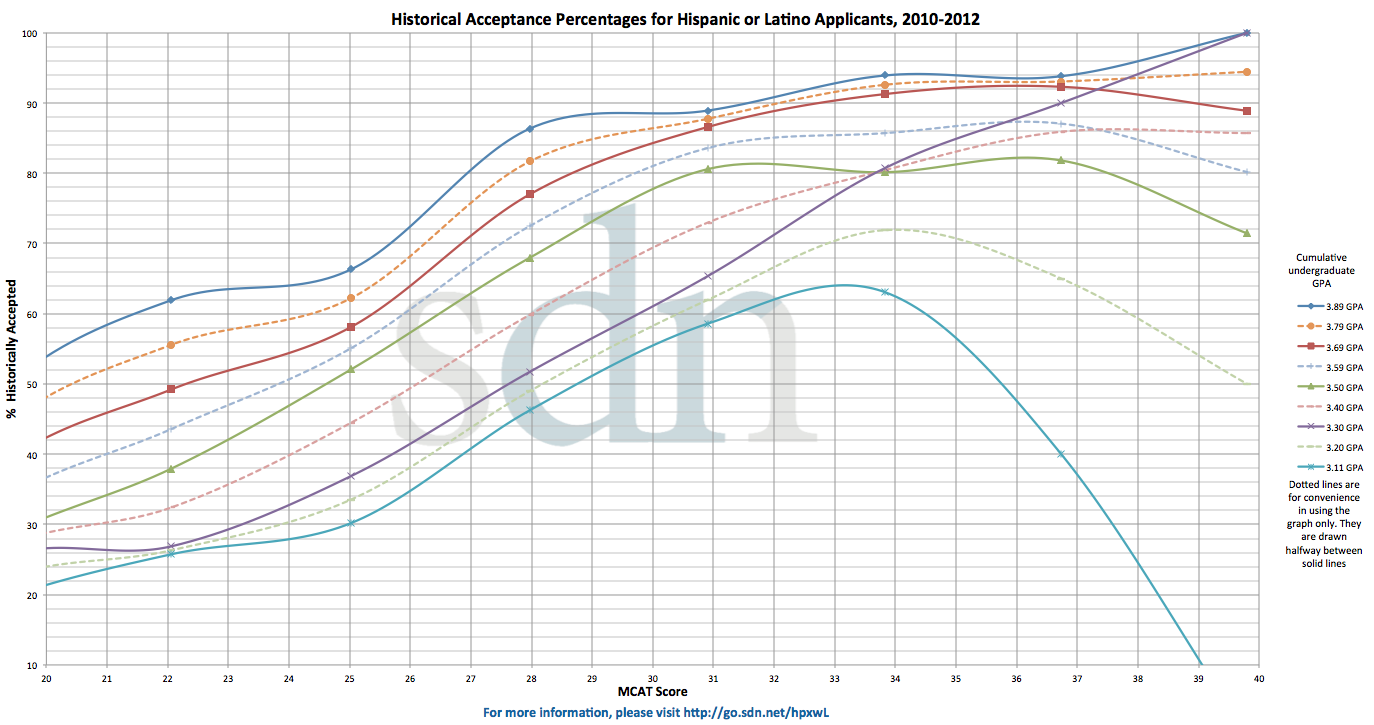
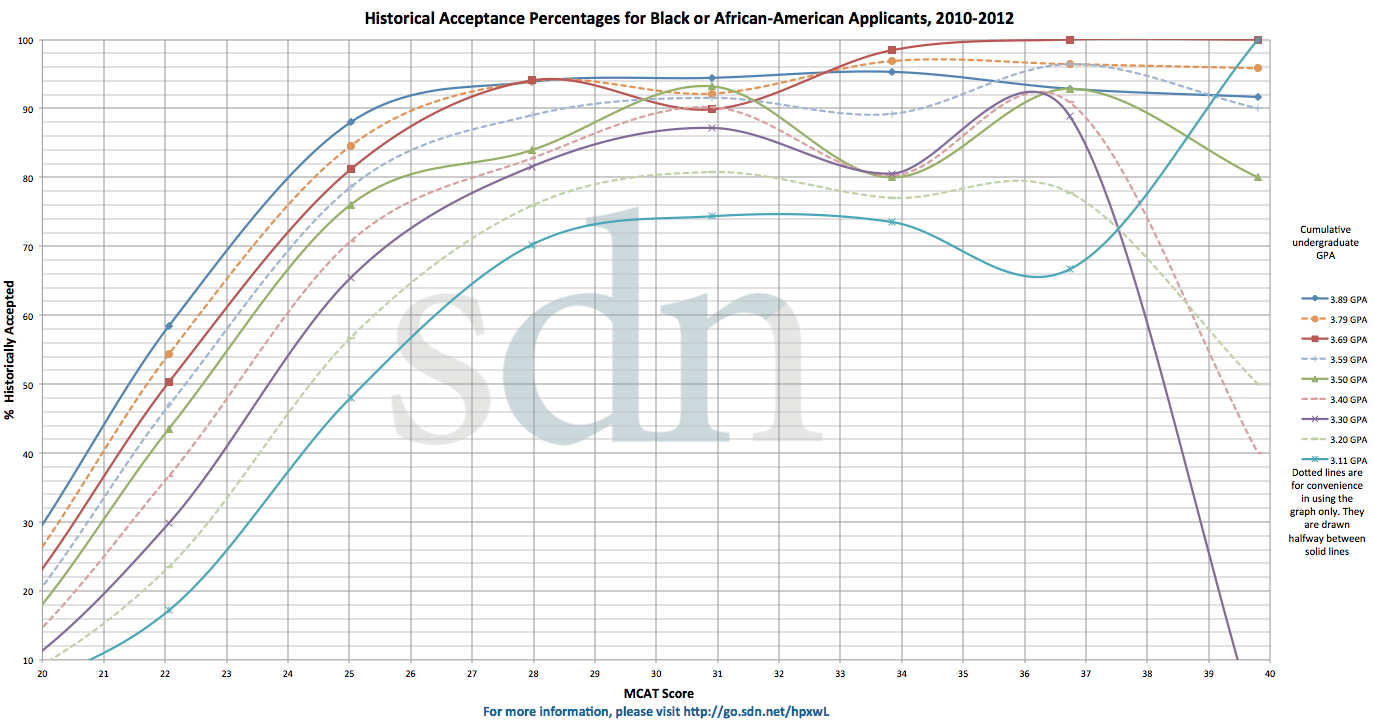
Acceptance percentage component: The acceptance percentages for figures 1-2 and 9 were calculated using the data from Table 24 referenced above. The percentages for figures 3-8 were calculated using Table 25.
Comment on skews: The graphs really didn't change much once I applied either the GPA or MCAT skew factors except at the limits of the data. For the 39-45 MCAT bin, the median score would be a 42. However, AAMC reports that 0.0% of all examinees scored a 43, 44, or 45. A better approximation of the bin is found using my method, yielding an average score of 39.8 for that bin.
Note on Dotted Lines in Figures 1, 3-8: The dotted lines do not correspond with any of the real data from AAMC. I just added in lines that are halfway between the solid lines so that it is easier to guess your chance.
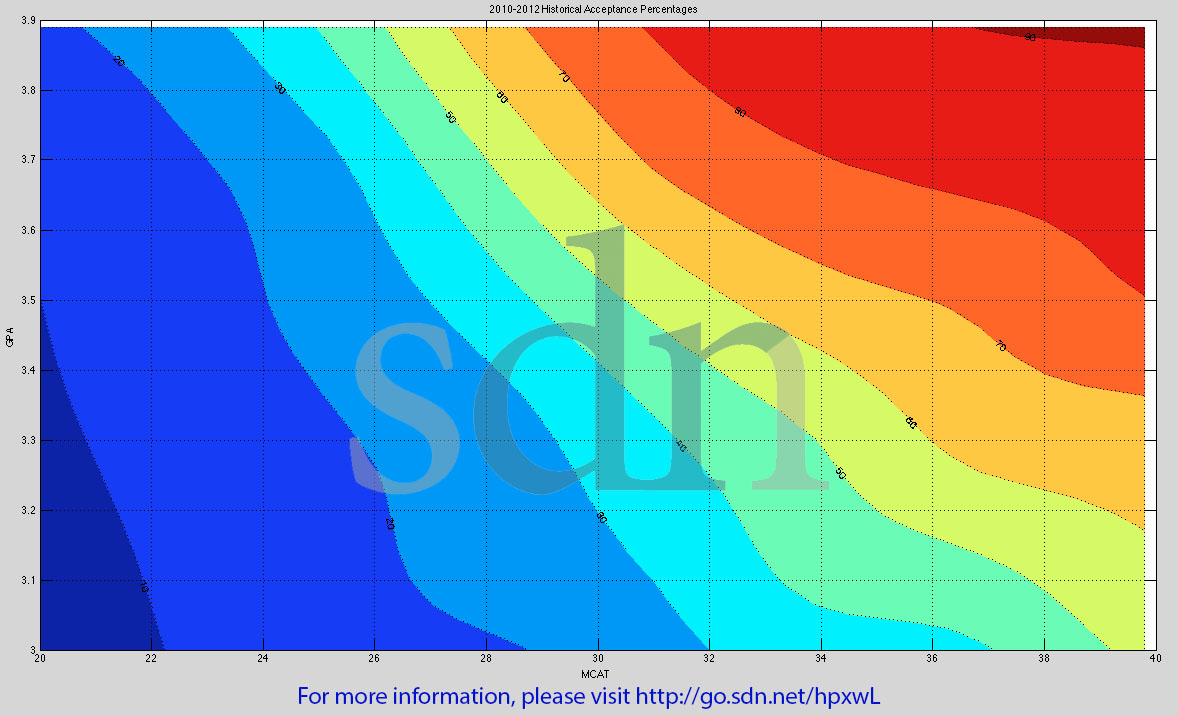
Method for Figure 12:
The data points are derived using the same method explained above.
For my graph,
LizzyM score is defined as MCAT+cGPA*10=LizzyM
The color-coding of the graph works by comparing the LizzyM score for the data point with the "average" percent contribution of matriculants (using an average at 32 MCAT and 3.67 cGPA). The average matriculant LizzyM of 68.7 comes 46.6% from MCAT and 53.4% from GPA. I used this as the baseline percentage, so any data point where GPA contributed more than 53.4% was colored red and data where GPA contributed less was colored blue.
Method for URM statistical comparison:
My two sources for data were the three Table 25 charts "MCAT and GPA for White," "MCAT and GPA for Asian," and "MCAT and GPA for Hispanic or Latino, Black or African American, or American Indian or Alaskan Native." For each MCAT and GPA combination, I found the percentage of White and Asian applicants accepted and multiplied it by the number of URM applicants. This gave me the number of URM applicants that I would expect to be accepted if the admissions process were completely equal i.e. race and ethnicity played no role. Next, I totaled up the "expected number of accepted URMs" (I got 4503.77 for the three year period) and compared it with the actual number of URMs accepted (there were 8693 URMs accepted over the three year period). The difference between the two numbers is 4189.22 URMs accepted beyond what we would expect for that three year window.
Now that I knew how many "extra" URMs were accepted beyond what would be expected, I found out the number of available seats at the 6 medical schools listed above. The rest of the calculations are straightforward.
Here's a step-by-step look at only one of the data points (students with an MCAT between 30 and 32 and a cGPA between 3.6 and 3.79):
3811 White acceptees+1298 Asian acceptees=5109 White or Asian acceptees
5146 White applicants+1761 Asian applicants=6907 White or Asian applicants
73.97% (or 0.7397) of White or Asian applicants in this range of stats were accepted
433 URMs applied with those same stats
We would expect 433*0.7397=320.3 of the URMs to be accepted if URMs had the same acceptance percentage as White/Asian applicants
(For this data point, 379 URMs were actually accepted, or 87.5% of the URM applicants)
How well does this method work? As validation of my overall method, consider the MCAT 30-32 bin and GPA 3.6-3.79 bin for all applicants. The percent chance given by Table 24 is 71.7%. The following data points from figure 1 are included in that bin:
Code:
GPA   MCAT  Acceptance %
3.6     30          57%
3.6     31          63%
3.6     32          68%
3.69    30          66%
3.69    31          72%
3.69    32          76%
3.79    30          72%
3.79    31          77%
3.79    32          80%
[Note:I used the 3.59 GPA line for the 3.6 data]
The average % chance for the 9 points above is 70.1%, slightly below the real average from AAMC data.
Flaws in my methods include:
1. The GPA skew factor is based a normal distribution created by only mean and SD. The real data would be skewed differently if I had access to it. A graph showing GPA for actual allopathic applicants is available in the print edition of the MSAR but is unavailable due to copyright issues for my analysis.
2. Applicants to allopathic medical schools have higher MCAT scores than examinees, making my MCAT skew factor slightly off too. A graph showing MCAT scores for actual allopathic applicants is available in the print edition of the MSAR but is unavailable due to copyright issues for my analysis.
3. The dotted lines are not based on any real data, but are interpolated lines drawn in the middle of the "real" data lines.
4. It is impossible to create a line to represent a 4.0 GPA. Likewise, it is impossible to estimate chances with a MCAT score over 40.
5. Your chances also depend on your race/ethnicity, but the sample size for each data point shrinks for most of these graphs. Some counterintuitive trends can be noticed due to the small sample size.
Disclaimer:
The chances portrayed in this thread are not guaranteed by any means. I am merely presenting the best available data in a more accessible format. This thread is not meant to replace the "What Are My Chances" subforum. Every application is different, so your results will vary depending on a multitude of factors.
Previous editions from other posters:
Here are two other previous editions based on the same idea. Send me a PM if you find others!
http://forums.studentdoctor.net/showthread.php?t=606875
http://forums.studentdoctor.net/show....php?p=7731327
Acknowledgements:
Big thanks to Catalystik for her advice and encouragement from the beginning of this project, apumic for advice on the statistics, mauberley for the suggestion to add a disclaimer, TriagePreMed for input on layout issues, and VC7777 for the suggestion to clarify the meaning of "your chances".


")

