- Joined
- Jan 25, 2012
- Messages
- 418
- Reaction score
- 93
This is awesome!

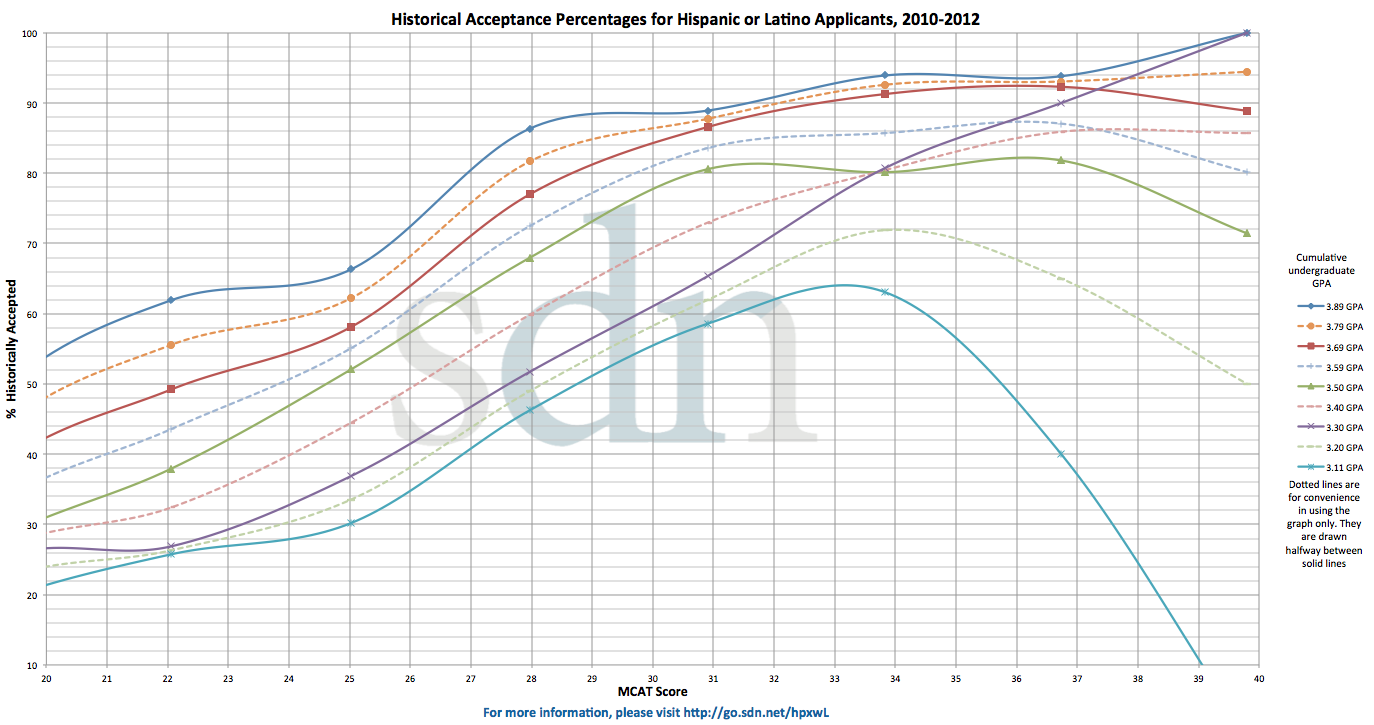
What's going on with the 3.11 gpa line?Chances for applicants who self-identify as Asian
Figure 5 (click on graph for higher resolution)
What's going on with the 3.11 gpa line?
The first graphs show success in what? success in gaining admission into medical school? or in making it through med school?
I'm working on some big changes for this thread, but I figured I might as well post the updated version of Figure 1 since I think it's pretty much done!
The rest of the figures have not been updated yet

So basically people that identify as black, can easily get with a 3.4GPA and a 36 MCAT?
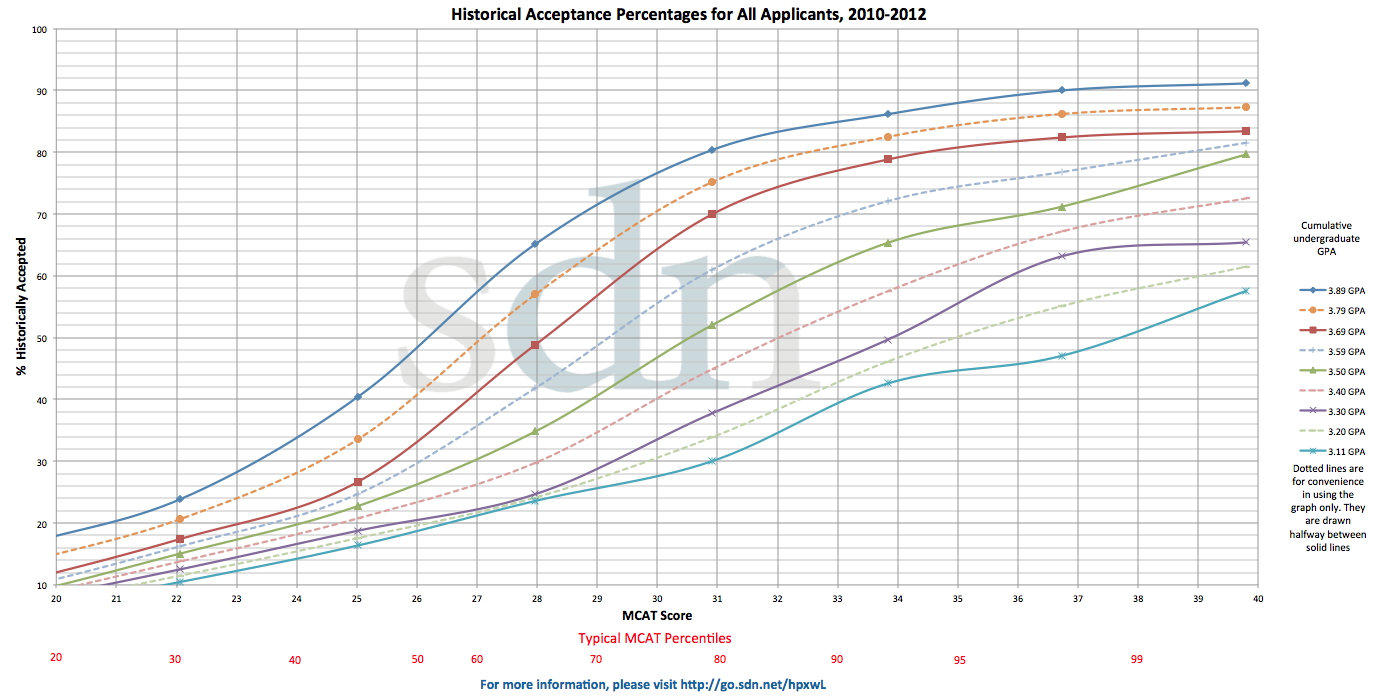
It means that 80% of applicants with a 3.9/30 were accepted into a medical school.
Do med school try to verify ethnicity at all?
If you describe yourself as AA and discuss how discrimination affected your college success and some very white looking person shows up for the interview, it might be a problem.
One person described himself as AA on the optional questions on a very competitive fellowship application. A very Caucasian WASPy guy showed up at the interview. Nobody asked, everyone noticed. He didn't get in, though not necessarily for that. But it may have influenced his rating at the interviews.
Which GPA should you use? The GPA used in the graphs below is total undergraduate GPA. You may use this spreadsheet to calculate your GPA. For official information on how your GPA is calculated, look at the following AMCAS resource. Your AMCAS GPA may be different from your school's calculation.
Which MCAT should you use? The MCAT score represented in the AAMC data is for the most recent score for each applicant. Keep in mind that each medical school may have their own policy on how they view multiple test scores.
What percentages are displayed? The percentages displayed in this thread are the percent of applicants with one or more acceptance at a U.S. allopathic (M.D.) school. The historical acceptance percentage also varies depending on ethnicity/race. Those percentages are displayed in later posts. Also, note that this percentage is only based on two data points-- cGPA and MCAT. A variety of other factors go into each admissions decision, so this percentage should not be taken to mean "your chance at acceptance."
Thanks for letting me know, Lee was able to get it fixed!@sector9: The African American and Latino graphs don't go to an enlarged version when clicked on anymore. Can this be fixed?
Does anyone know where to find a chart of "total applicants, interviewed, enrolled for both instate and out of state", for all the schools?I think that the best resource I've seen is AMCAS's Twitter feed https://twitter.com/amcasinfo
They have provided periodic updates about the number of submitted apps. Most recent tweet from an hour ago was 42,135 submitted apps. 6 days ago it was 40,267. Should be winding down as they usually top out around 43k/44k
People submitting now are certainly way behind you since you were already verified
Why didn't anyone ask? If he was lying, it might stop him from doing it again. If it was genetics playing a freaky limbo game, it could have made for a compelling story (identifying as white to avoid discrimination but feeling guilt over denying AA family and heritage, it's practically a Hollywood story!).
Sorry if that sounds flippant, I'm being serious. Weird things happen.
I'm not asking ANY questions about race, gender, sexuality, family life, kids, etc. at a professional interview. That's how you all get sued (and lose) when the candidate doesn't get the position. If you want to bring it up, that's fine. I'm not asking any probing follow up questions about it either.
One of our friends is the VP of HR for the US office of a large corporation, they get paid to screen these people using tricks to get the applicants to admit things that they cannot legally ask. It's a common tactic. There's a tell all book about it that she recommended to my wife when she was looking for an executive level job with a different company (Marital status, kids, health and disability hx, spouse's job, etc.). Her HR interviews (2) tried variations of many of the techniques in the book to extract that info.
Forewarned is forearmed.
In medicine we're all amateur interviewers. If they got good training, have a couple LORs saying they don't suck, want to work there, can communicate in English, and don't have any felony convictions, they've got a good chance at a job. The corporate world is ultra competitive and cutthroat, particularly for senior level positions.
When do they release the data?AACOMAS, the DO application service, has not released similar data.
They never have so far, but we'd all love it if they did.When do they release the data?
It averages. Aka just put them both in and forget they were the same.Question... For the excel to determine your AMCAS gpa... How does one factor in a course that they retook?
Thanks for the help! Great thread!
Even the credits? Thanks for the replyIt averages. Aka just put them both in and forget they were the same.
2010-2012 Historical Acceptance Percentages
How To Use
'10-'12 Chart for All Applicants
'10-'12 Chart for Hispanic or Latino Applicants
'10-'12 Chart for Black or African American Applicants
'10-'12 Chart for Asian Applicants
'10-'12 Chart for White Applicants
'10-'12 Chart for Hispanic or Latino, Black or African American, or American Indian or Alaska Native ("URM")
'10-'12 Chart for White or Asian Applicants ("ORM")
'10-'12 3D Plot
Other Statistics
Changes to Acceptance Percentages Over Time
How many spots are taken by URM applicants with less-competitive stats?
Is a high GPA/low MCAT or low GPA/high MCAT LizzyM score better?
Methods
Methods

AN ENTIRE LIFELONG CAREER OF JOY, CONSTANT LEARNING, MAKING A DIFFERENCE, HELPING OTHERS, SERVING SOCIETY.

Probably too small of a sample size to perform meaningful data analysis.Question, Why does it not have info for Native American/ Alaskan alone? It has data for African American, latino, Native american, it has data for African American, and it has data for Latino. But it has no data for just Native American... Porque?
Great work! thanks so much!
Figure 1 (click on graph for higher resolution)
Find the colored line closest to your cumulative undergraduate GPA (cGPA) by using the legend on the right. Then find your MCAT score on the x-axis. Your historical acceptance percentage is on the y-axis.
The solid lines correspond with the actual AAMC data. The dotted lines are merely interpolated lines drawn halfway between the solid lines.
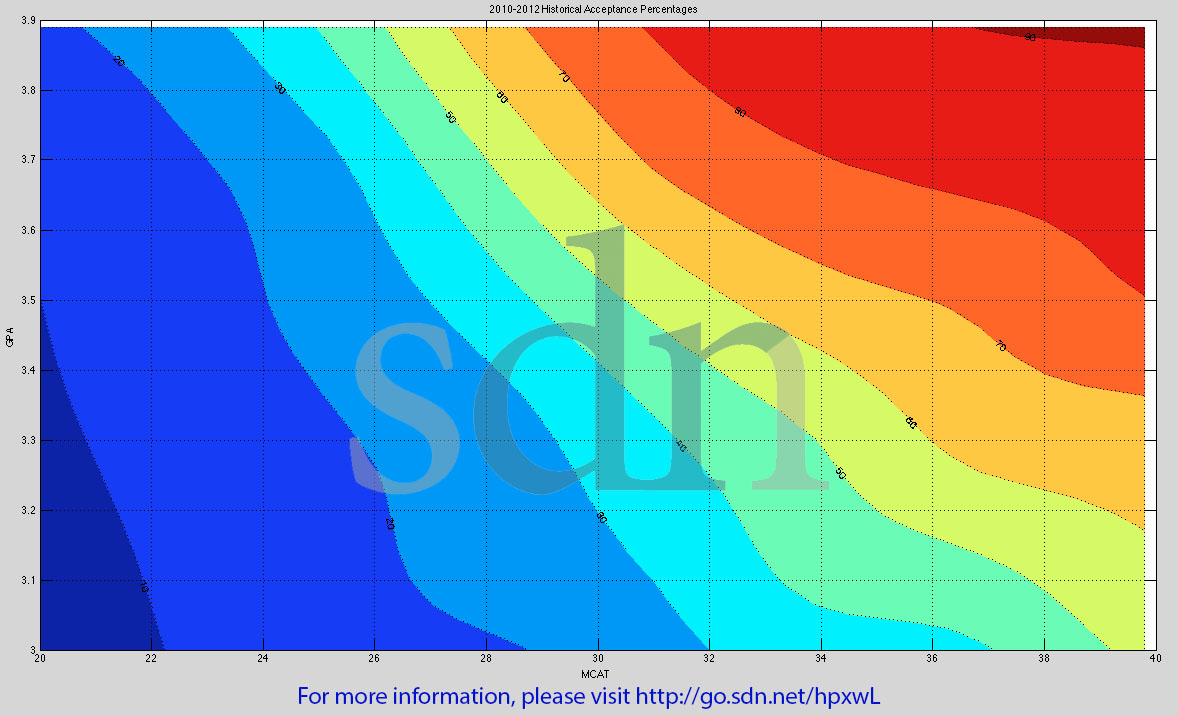
Contour plot of the same data
Figure 2 (click on figure for higher resolution)
I don't understand why the 3.11 GPA (bottom line) % accepted rapidly declines after 34 MCAT?Chances for applicants who self-identify as Hispanic or Latino
Figure 3 (click on graph for higher resolution)
The short answer is that it's because of sample size. Only 1 person applied with those stats and he/she wasn't accepted, so the accepted % for those stats was 0% and the graph looks weird because of that.I don't understand why the 3.11 GPA (bottom line) % accepted rapidly declines after 34 MCAT?
That's a good question to ask the original author. @sector9.When will thee #s be updated for '13 and '14 ?
When will thee #s be updated for '13 and '14 ?
Hopefully I'll have time over winter break!That's a good question to ask the original author. @sector9.
Do you have a chart like those but for international students?2010-2012 Historical Acceptance Percentages
How To Use
'10-'12 Chart for All Applicants
'10-'12 Chart for Hispanic or Latino Applicants
'10-'12 Chart for Black or African American Applicants
'10-'12 Chart for Asian Applicants
'10-'12 Chart for White Applicants
'10-'12 Chart for Hispanic or Latino, Black or African American, or American Indian or Alaska Native ("URM")
'10-'12 Chart for White or Asian Applicants ("ORM")
'10-'12 3D Plot
Other Statistics
Changes to Acceptance Percentages Over Time
How many spots are taken by URM applicants with less-competitive stats?
Is a high GPA/low MCAT or low GPA/high MCAT LizzyM score better?
Methods
Methods
Unfortunately, data specific to International applicants and matriculants is much less specific and not race-based.Do you have a chart like those but for international students?
Thanks!Unfortunately, data specific to International applicants and matriculants is much less specific and not race-based.
Canadian and other internationals
AAMC 2010-2011 stats for acceptance: http://forums.studentdoctor.net/showthread.php?p=10355297 (included because older stats broke down the differences between Canadians and all other Internationals, which AMCAS doesn't do anymore).
2014 stats: http://forums.studentdoctor.net/thr...schools-i-am-targeting.1114337/#post-16038685
Any updates yet??? The AAMC charts look fairly similar to 2014 numbers-wise, but these graphs are much more readable even if they won't look incredibly different--or maybe they do, a graph would help, hint. No just kidding, not trying to be demanding. This is great work though, probably one of the most important singular post on SDN.Hopefully I'll have time over winter break!