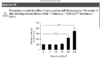
The x-axis shows lipoic acid concentration. The y-axis show mtKAS mRNA levels and mtKAS protein levels.
We're interested to see what happens to the mRNA and proteins levels as we increase lipoic acid. Going from left to right on the x-axis, as we increase lipoic acid levels, the mRNA and proteins levels keep increasing. This indicates positive feedback because more lipoic acid positively turns on mRNA and protein expression.
If it was negative feedback, we might see mRNA and protein levels hit a peak and then decrease after more lipoic acid is added.