- Joined
- Jun 17, 2014
- Messages
- 63,099
- Reaction score
- 154,727
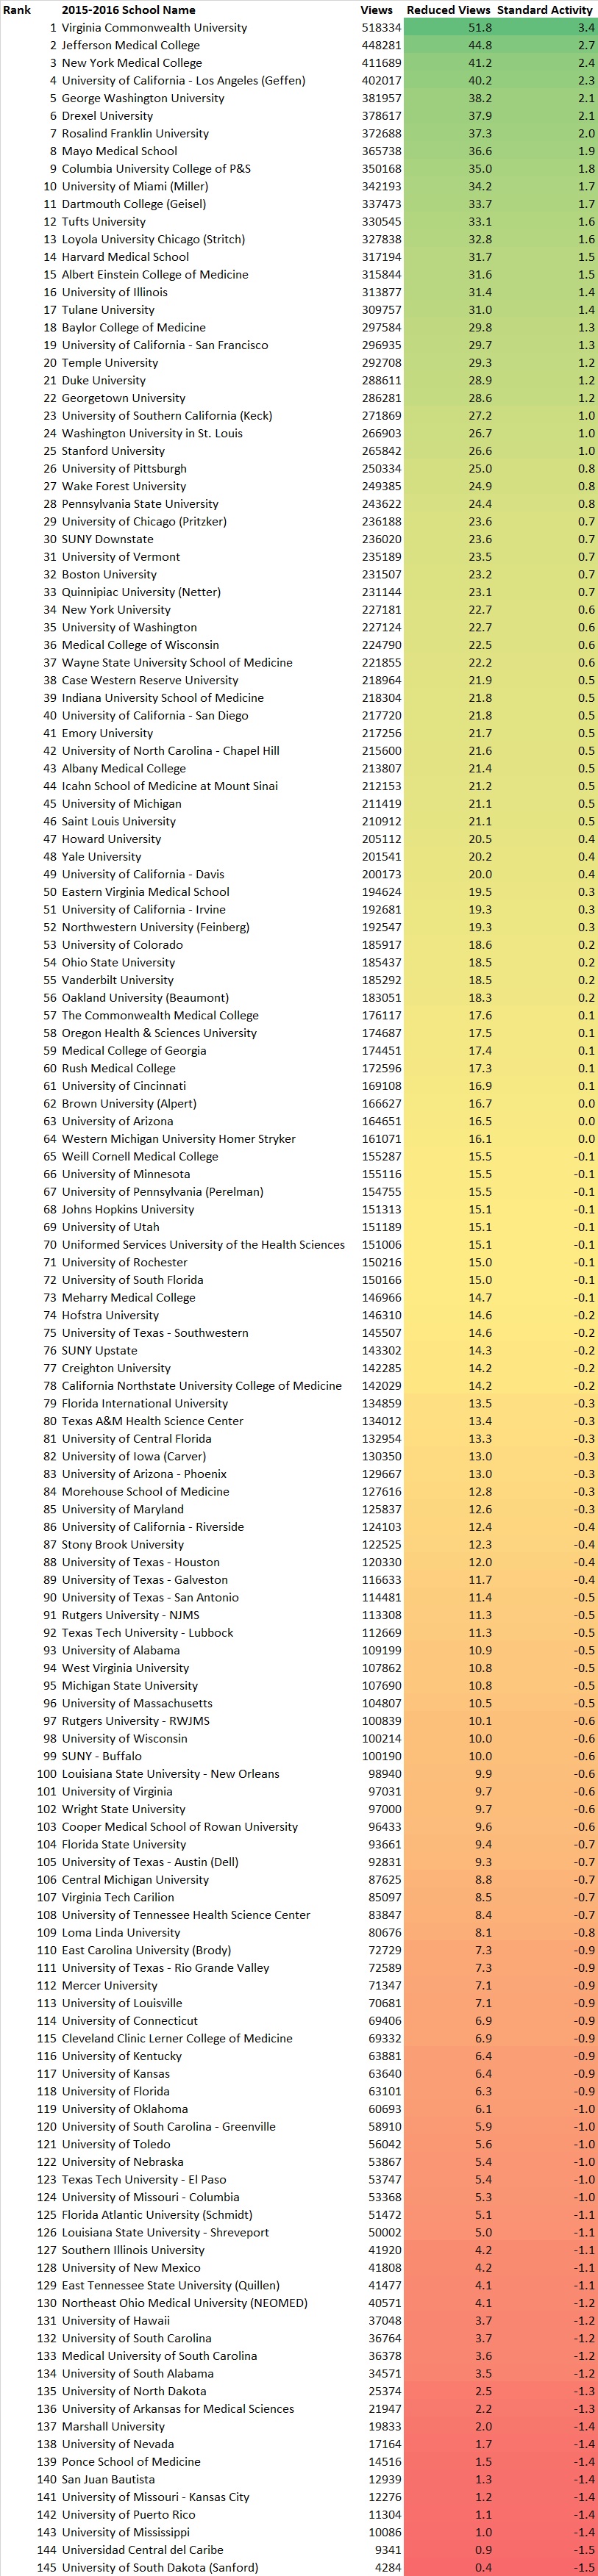
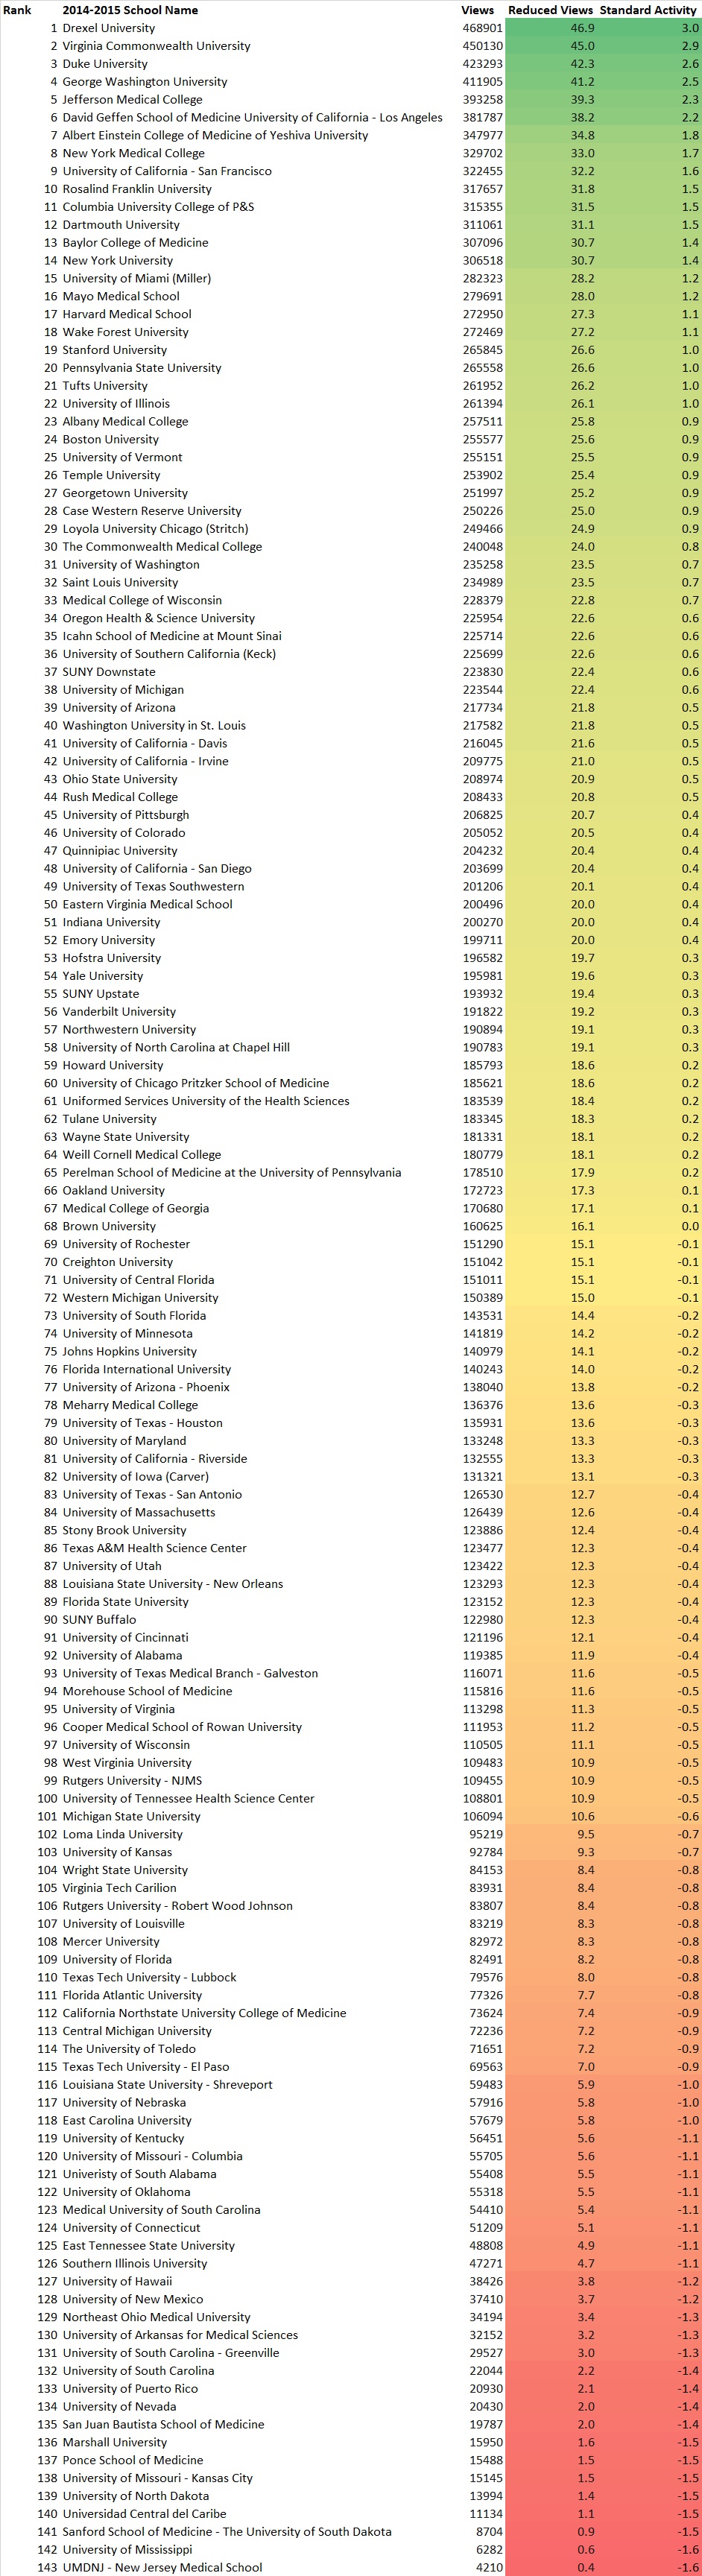
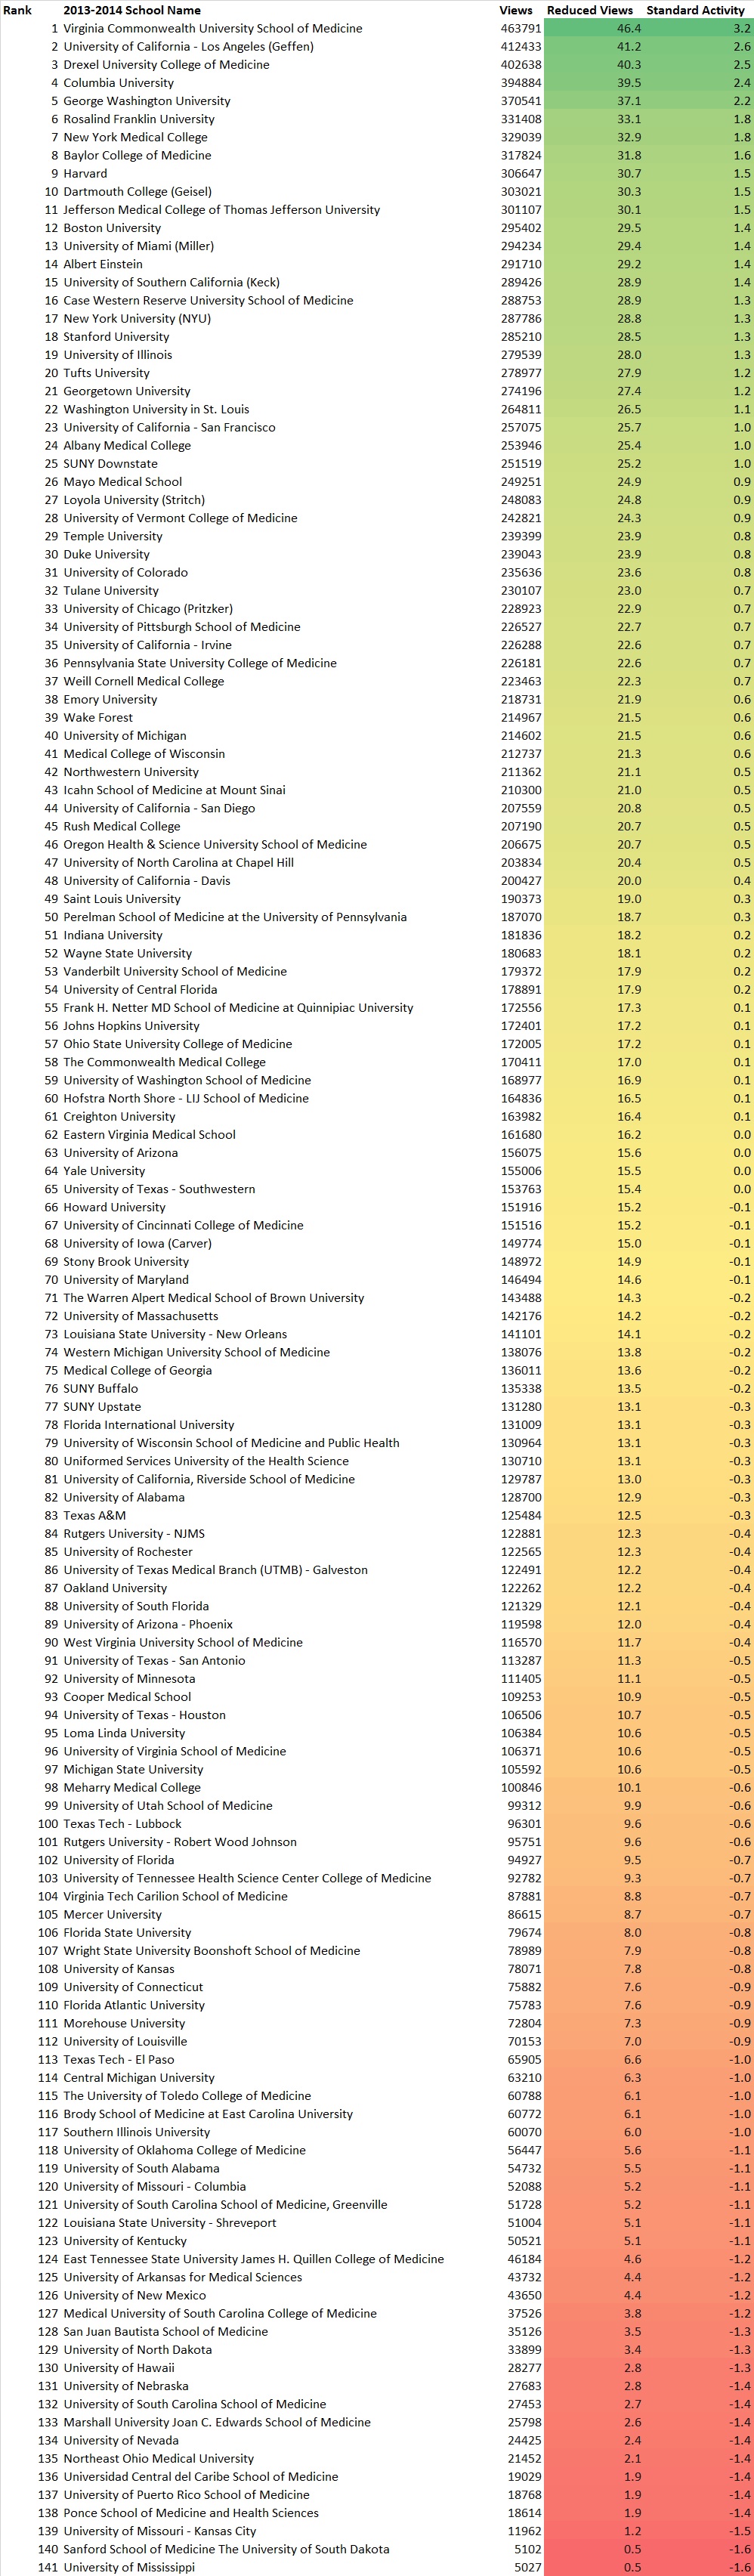
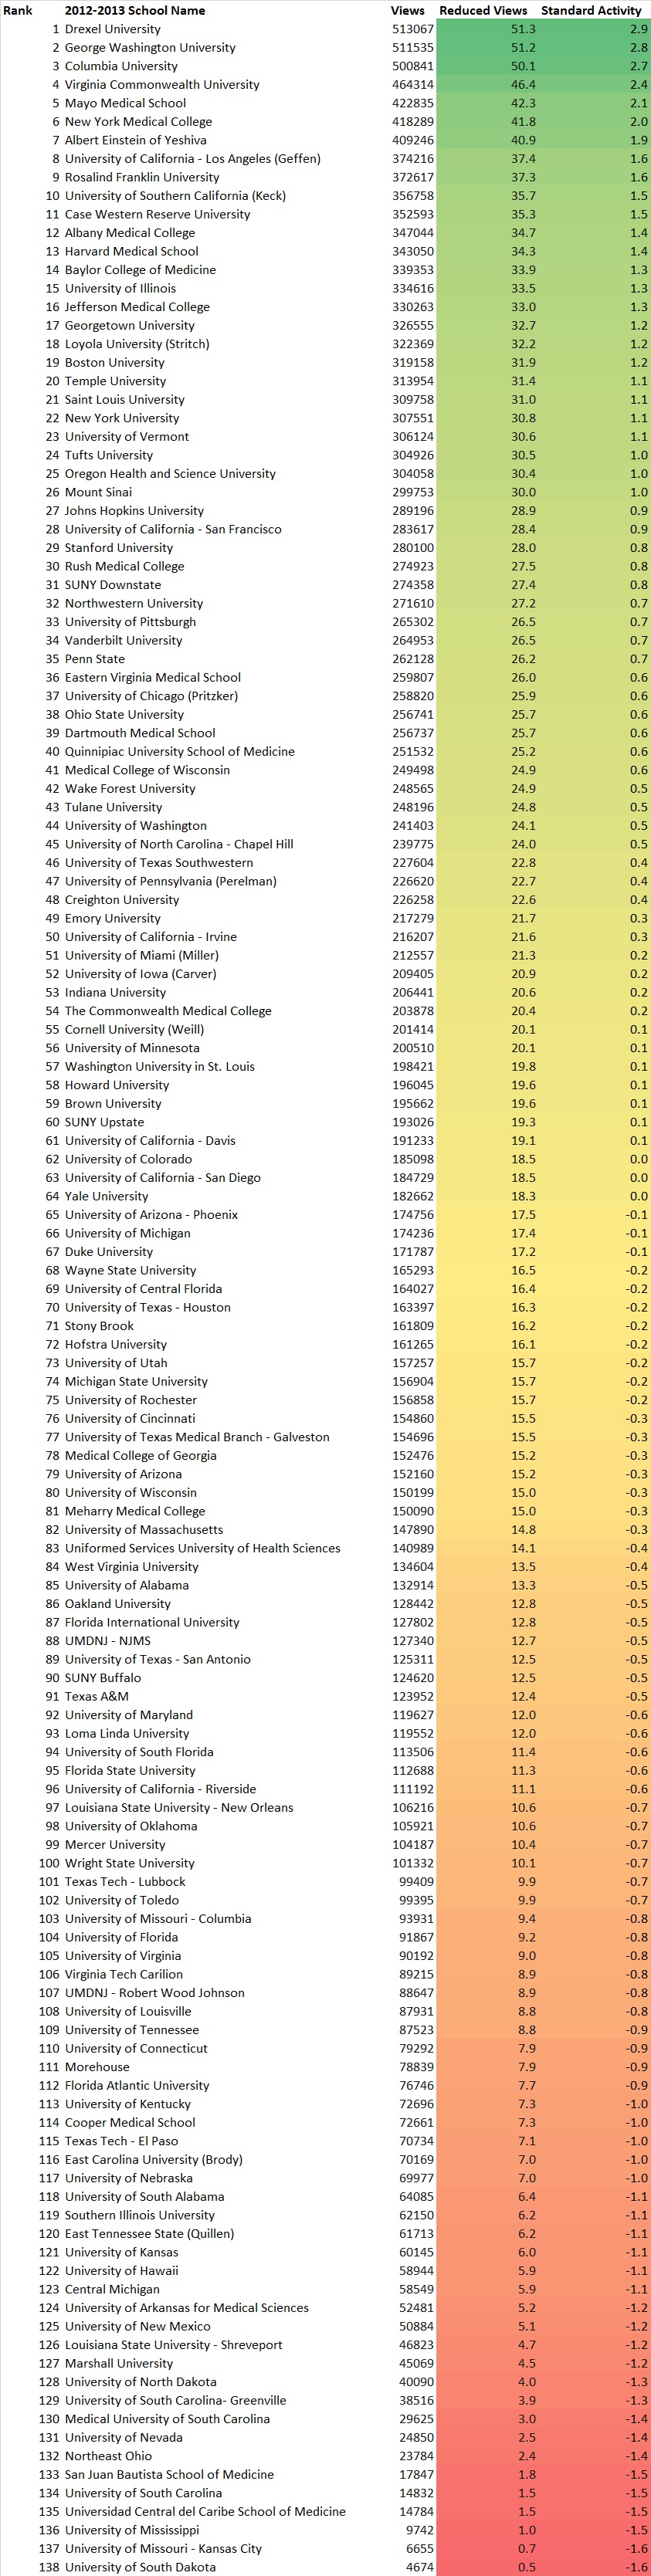
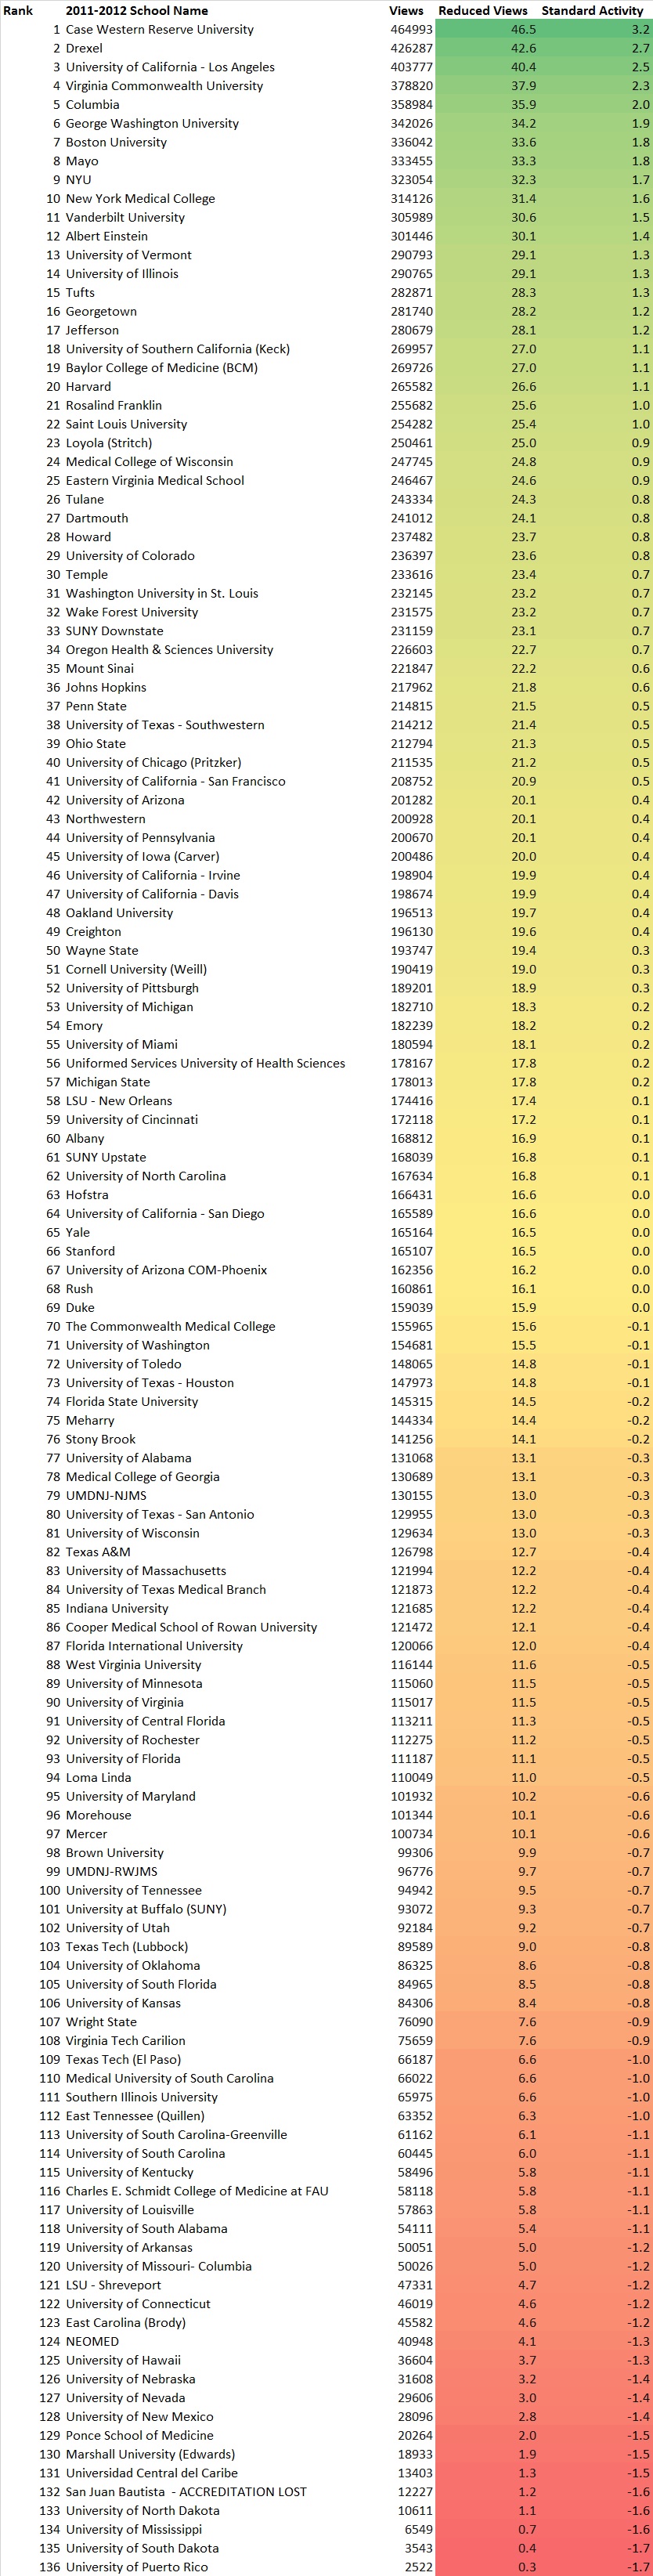
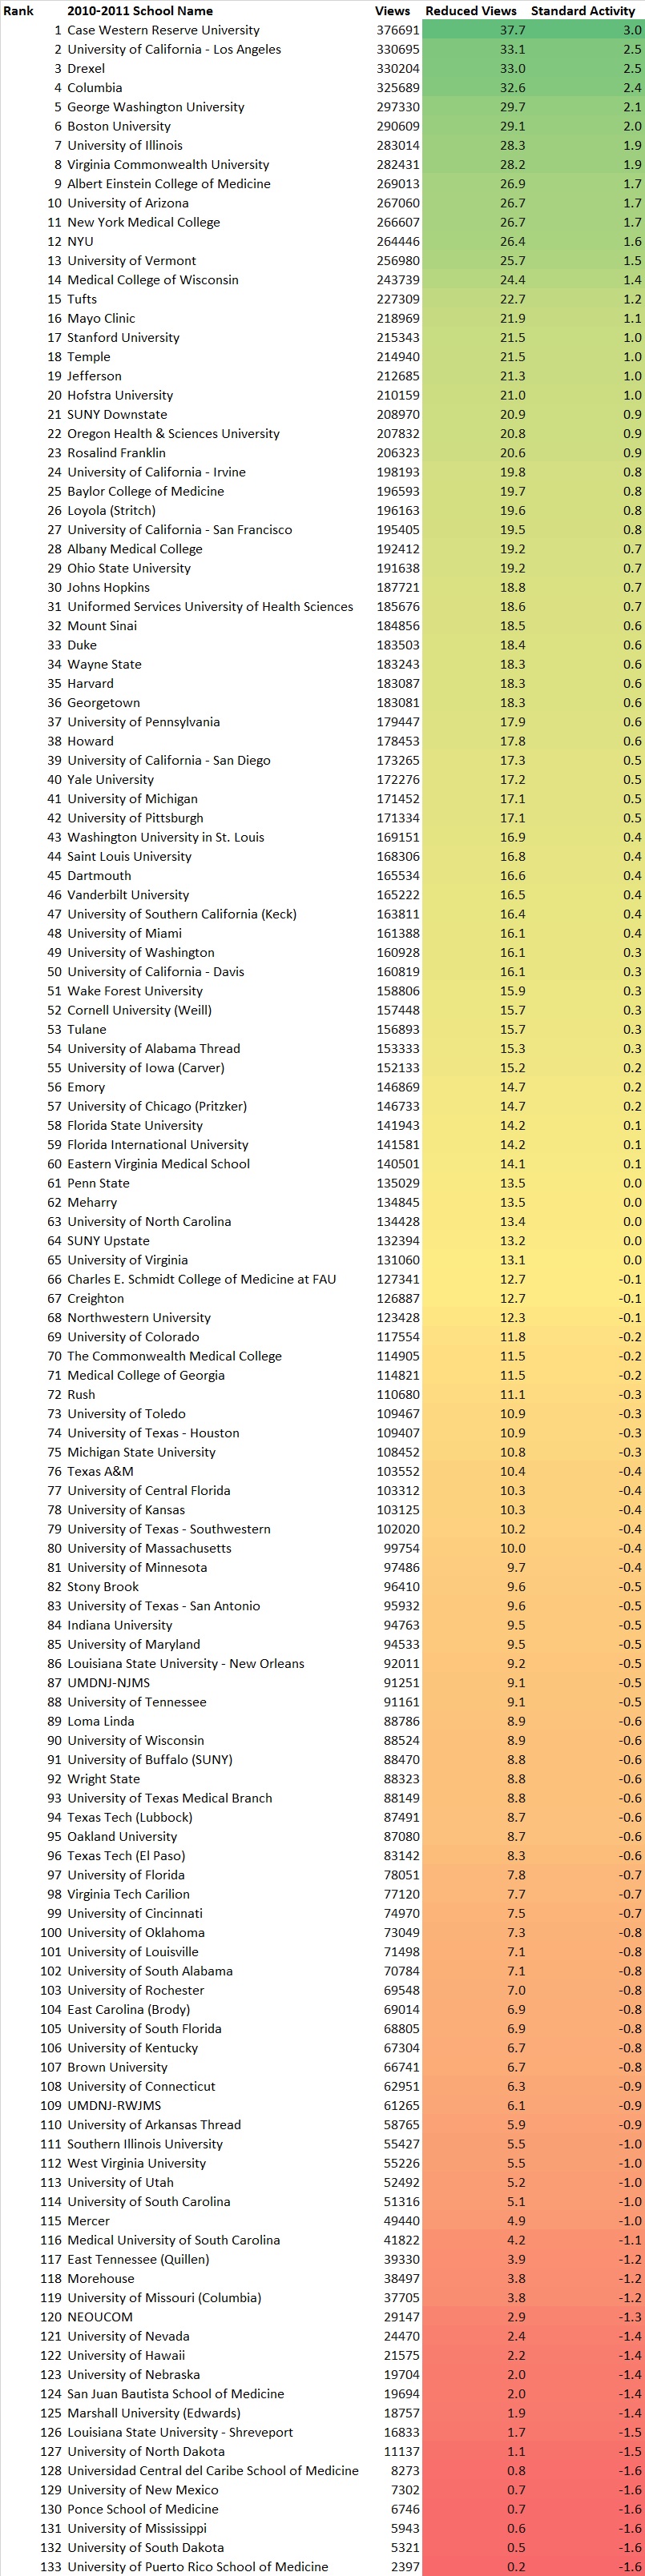
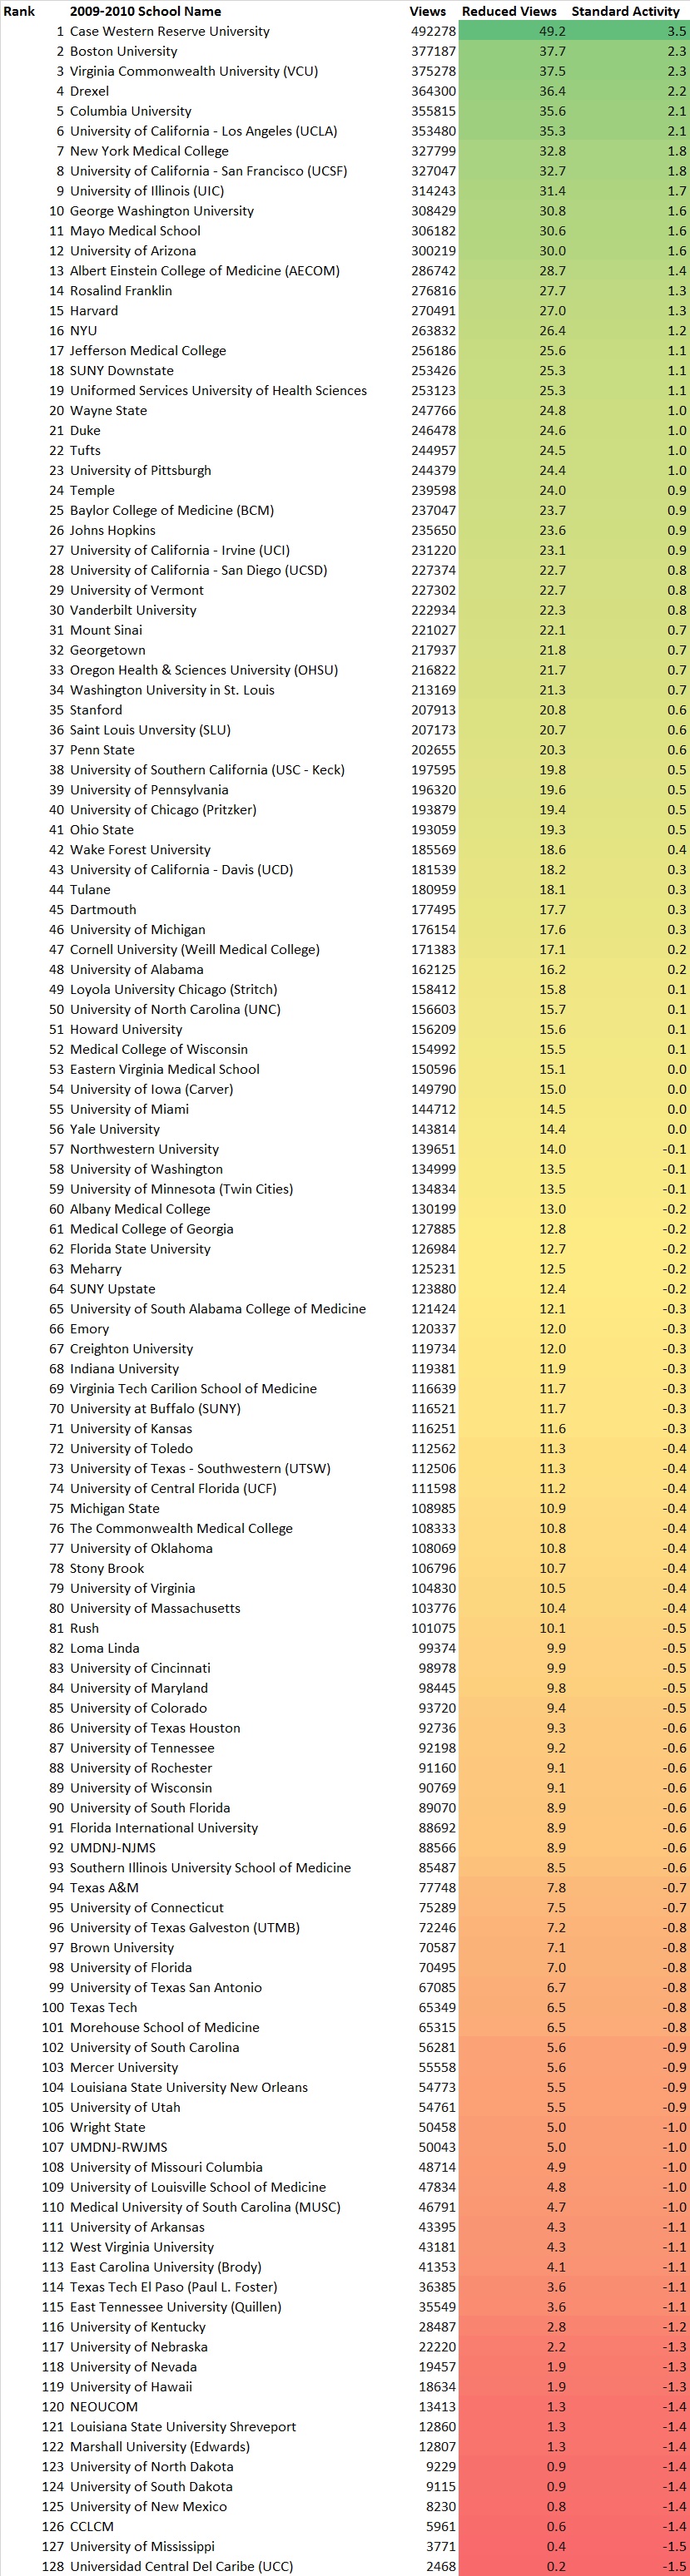
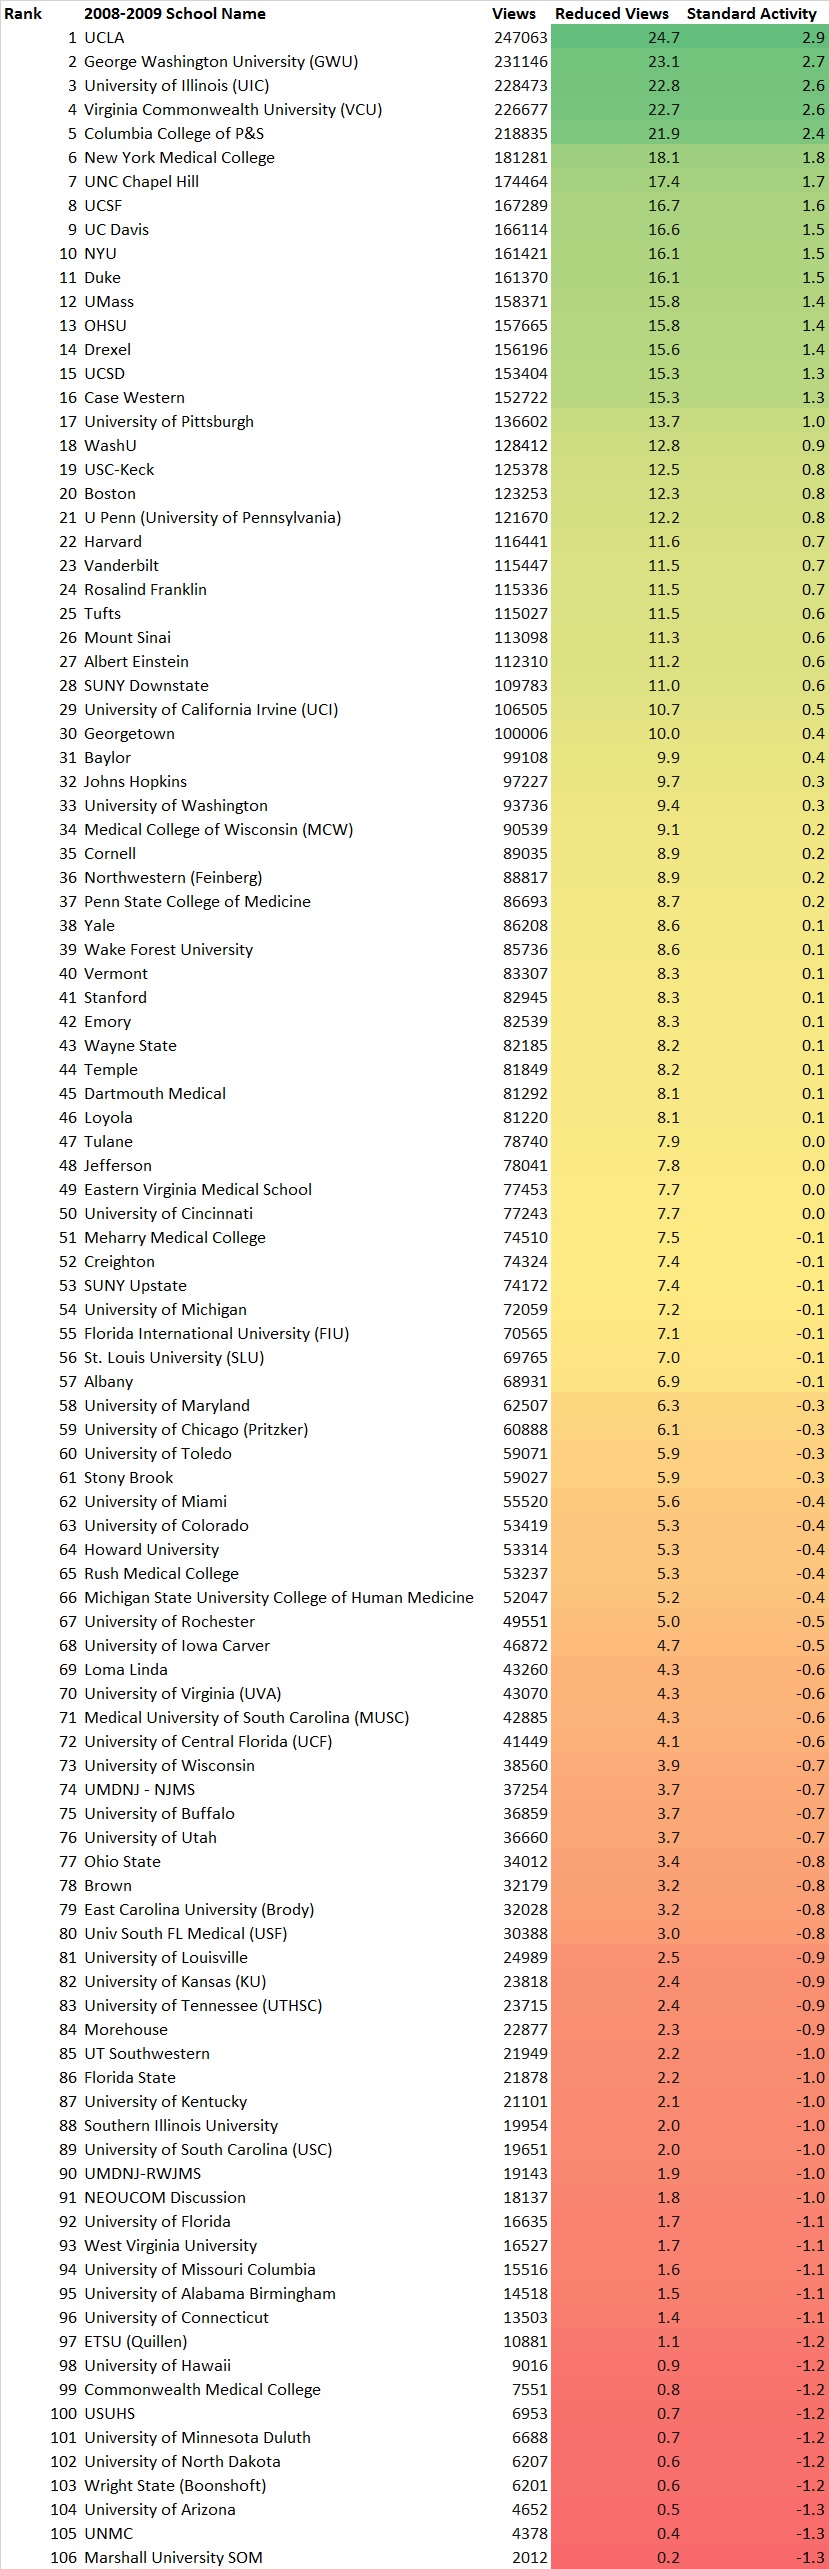
Some interesting data I found from the previous school-specific discussion threads. Given a typical SDN preallo user's obsession with medical school rankings and Top 20 schools, I wanted to see how popular various medical schools are on these forums. School popularity can be determined by measuring how active the school's application thread is on SDN.
Methodology
Now, there are several ways of measuring thread activity, but the simplest and most reliable metric is recording the total number of page views for that thread. Page views measure how many times a thread has been visited, whether by lurking or posting. However, the exact total number of page views changes regularly due to random visits. For ranking purposes, the variations can be controlled by dividing the total number of page views by 10,000, which makes the resulting numbers manageable.
To rank medical schools for each application cycle, I did the following:
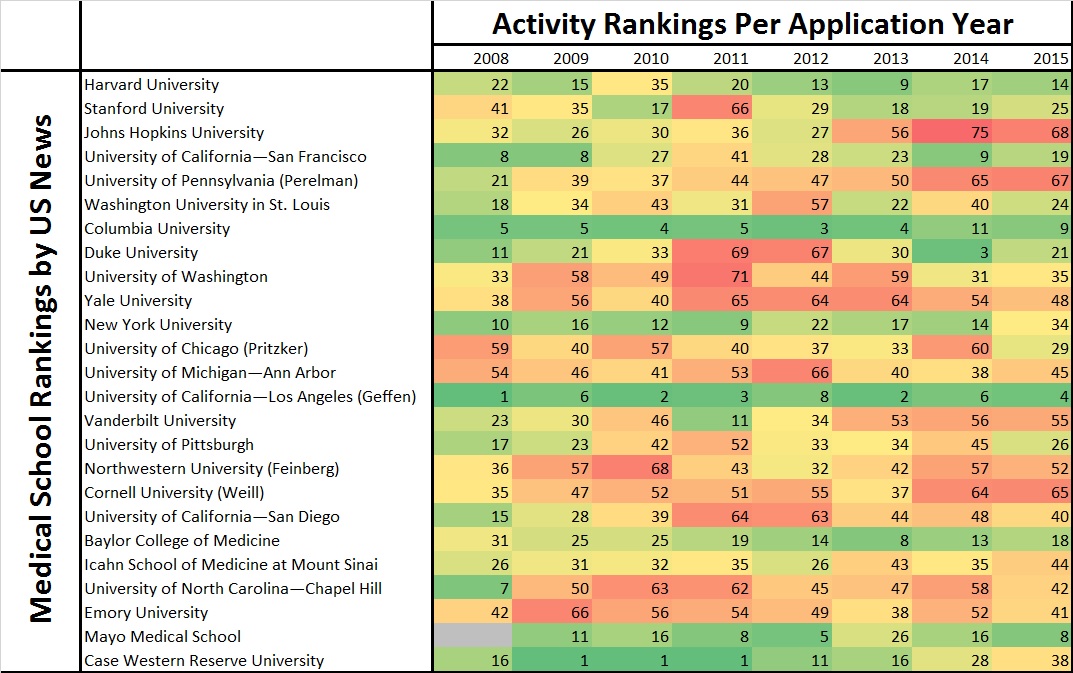
Comparison to US News Top 25 Rankings
The below table shows how the US News Top 25 Medical Schools (by Research Rankings) fare with respect to SDN activity.

Surprisingly, there isn't a 2008-2009 application thread for Mayo!
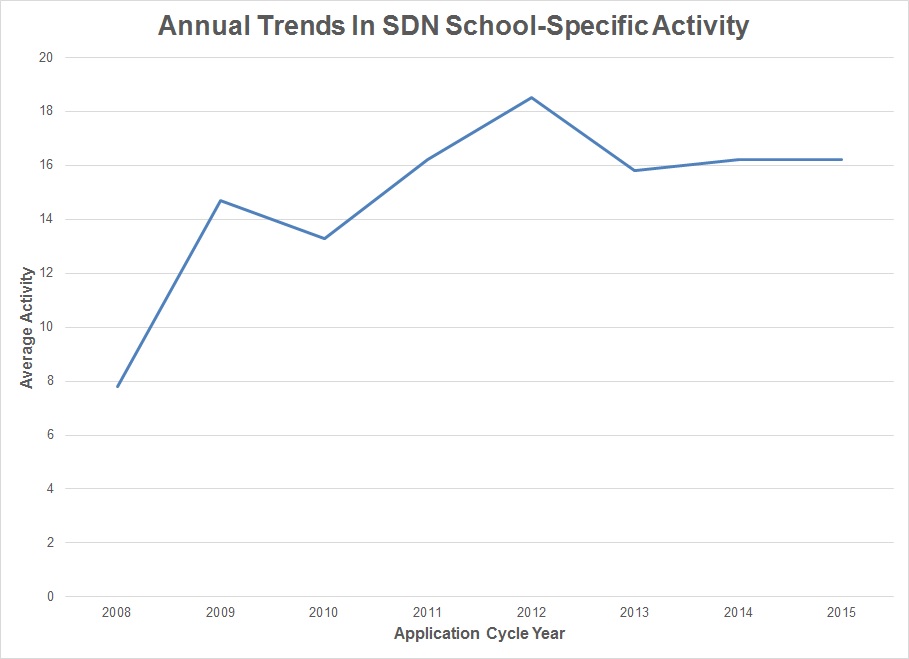
Activity Trends
The below graph shows trends in average activity ratings over eight application cycles.

Hope you find this useful, and let me know of any errors made in this report. I'll update this thread to include the 2016-2017 application cycle next year once the cycle is done.
Methodology
Now, there are several ways of measuring thread activity, but the simplest and most reliable metric is recording the total number of page views for that thread. Page views measure how many times a thread has been visited, whether by lurking or posting. However, the exact total number of page views changes regularly due to random visits. For ranking purposes, the variations can be controlled by dividing the total number of page views by 10,000, which makes the resulting numbers manageable.
To rank medical schools for each application cycle, I did the following:
- Visited the Allopathic School-Specific Discussions (<2016) Forums
- Sorted by title in ascending order (so this means numbers come before A-Z)
- Noted the first application cycle (this was 2008-2009) and recorded the total number of page views for each school thread in an Excel spreadsheet; did this for application cycles up until and including 2015-2016 cycle
- Divided the total number of page views by 10,000 (this is called reduced views in the spreadsheet)
- Calculated the average and standard deviation for each application cycle
- Used the average and standard deviation to standardize activity ratings (basically, how many standard deviations are each school away from the average; this is simply standard activity = (activity - average)/standard deviation)
- Sorted by standardized activity in descending order (so from largest to smallest values)
Comparison to US News Top 25 Rankings
The below table shows how the US News Top 25 Medical Schools (by Research Rankings) fare with respect to SDN activity.
Surprisingly, there isn't a 2008-2009 application thread for Mayo!
Activity Trends
The below graph shows trends in average activity ratings over eight application cycles.
Hope you find this useful, and let me know of any errors made in this report. I'll update this thread to include the 2016-2017 application cycle next year once the cycle is done.
Last edited: