- Joined
- Dec 18, 2015
- Messages
- 3,216
- Reaction score
- 4,930
The data are downloadable here.
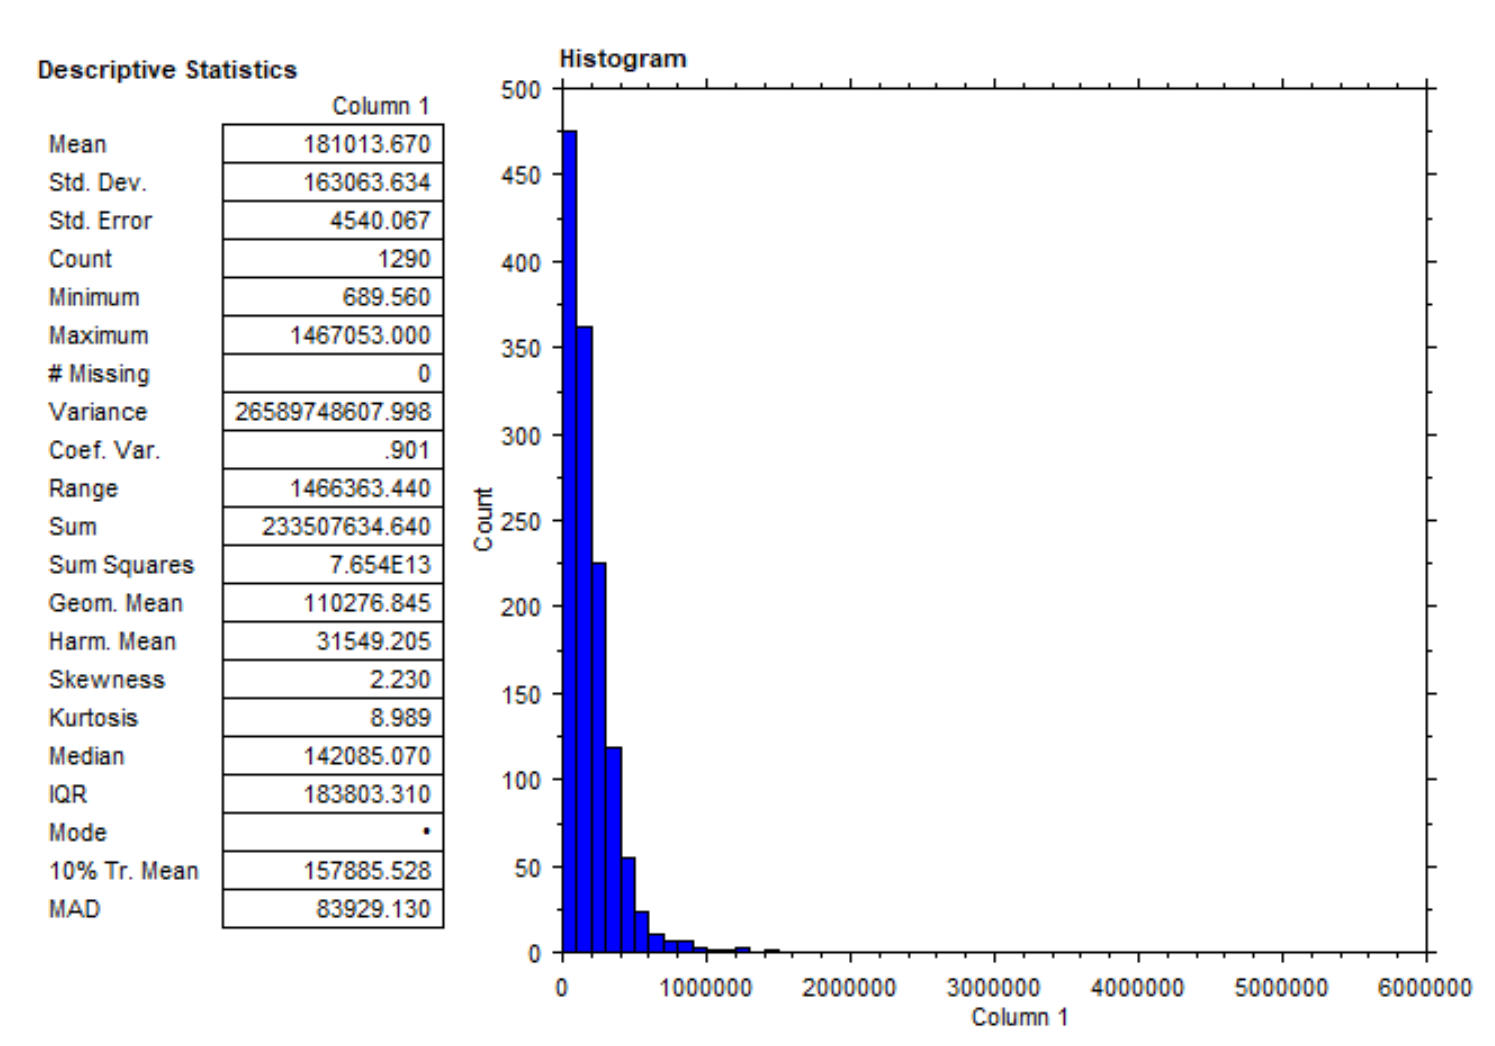
There's an orgy of data in this spreadsheet. I will come back here from time to time to update, observe, etc. But first things first. This is the most recent data from 2018. Here are the "top 10" in radiation oncology for that year. Name, location, amount paid by Medicare (2 significant digits).
JW.... Provision Knoxville.... $8.5 million
TK.... Naples, FL.... $5.0 million
AM.... Provision Knoxville.... $5.1 million
TS.... TX Center for Proton Therapy.... $3.1 million
AL.... TX Center for Proton Therapy.... $2.9 million
DD.... Port Charlotte, FL.... $4.0 million
BC.... Princeton Radiology Associates.... $2.4 million
MS.... Urology San Antonio.... $2.3 million
HT.... Princeton Radiology Associates.... $2.3 million
AB.... Ft Myers, FL.... $3.4 million
EDIT1:
PROTON THERAPY CENTER HOUSTON LTD... Houston, TX... $8.3 million
Cursory glance I believe 7/11 are protons, 3/11 are (were) 21st Century Oncology, and 1/11 a "urorads."
Hey ASTRO. C'mon man.
Last edited:

") ....... mods?
....... mods?