
- Joined
- Mar 22, 2012
- Messages
- 7,691
- Reaction score
- 13,035
Link to online WARS Calculator
Latest version is 1.3 (Released January 2017)
Collaborator credit: @To be MD
Introduction
As some of you may have seen, I've recently been pioneering a new system that helps applicants figure out where they stand with respect to medical school admissions as well as giving them a place to start when it comes to creating a school list. My system is a comprehensive algorithm that takes into account all of the major (and some of the minor!) factors that go into building a successful application! This post aims to elucidate the process by which this method scores an applicant as well as get community input on the algorithm to attempt to strengthen it even more.
When I first started building this system, I used a google doc spreadsheet to make notes and create the initial versions of some of the formulas that go into this program. In order to do this, I scored myself, other applicants I knew in real life, and many applications I found in the What Are My Chances (WAMC) forum to adjust rating scales to try and create a generalized model that placed applicants into appropriate discrete categories.
Once I had my initial quantitative rating system in place, I wrote a Python script that allowed me to easily score an applicant based on factors normally included in their WAMC thread and which gives the output that I normally post in these threads. This is the point at which I started posting in threads as well to see how well my formulations matched up with community suggestions.
Finally, after some more tweaking, I created a comprehensive Excel document that contains instructions, qualitative descriptions of each factor that are then reduced to a numerical score, a place to input score values and receive a score in addition to a category level and school breakdown, and a page that displays which schools are in which categories. This document is available for download.
I will go through each of these factors in this post to articulate how they fit into the overall scoring paradigm as well as solicit input from the SDN community about how to increase the accuracy of this system.
The LizzyM System
This system was originally created as a supplement to, not a replacement for, the already widely-utilized LizzyM scoring system. As a reference, the LizzyM score is defined as (GPA*10)+MCAT and may contain a +1 or -1 modifier in certain situations. The applicant's LizzyM score is then compared to the LizzyM score for a school to determine whether or not the applicant is statistically competitive for that school. However, the inherent simplicity of the LizzyM score, while making it quick and easy to generate and apply, also creates problems endemic to systems that reduce and generalize. The two major simplifications are the reduction of an entire application to two (already numerical) metrics and the assumption that the LizzyM score accounts for the majority of, if not all of, the variability attributed to selectivity.
While there is merit to these assumptions, which is why the LizzyM score is so widely used, there are also deficiencies that need to be addressed in order to create a more accurate system for assessing an application. One of these deficiencies is that certain schools with similar LizzyM schools may be in very different levels of competitiveness. For example, although UVA and Duke have identical LizzyM scores, it is clear that Duke is a much more selective school than UVA. Additionally, small differences in LizzyM score become significant when using this metric to assess competitiveness for two similar schools. For example, Duke has a LizzyM score of 75, while Yale has a LizzyM score of 76; both schools are similarly selective, but someone might (very mistakenly) advise a applicant with a 3.9/36 that they are more competitive for Duke than they are for Yale. Finally, the LizzyM score is used as a way to tell if someone is statistically competitive for a single school and is significantly less useful for helping an applicant come up with a list of schools.
The Applicant Rating System - Overview
The WedgeDawg Applicant Rating System (ARS) was created to address these deficiencies. It takes into account most of the factors that make up an application to medical school, gives an applicant a separate score for each one, and then gives an applicant a numerical rating. This numerical rating is then translated to a category level and a profile of schools to apply to is created based on that category.
One of the major assumptions of the ARS is that applicants can be broadly classified in terms of competitiveness into one of 6 categories. Within these categories, distinctions between applicants are might lower than the differences between applicants that are in separate groups. Much of the variability that occurs between two applicants in the same group comes from subjective parts of the application that are not taken into account here, namely the personal statement, letters of recommendation, secondary essays, and their interviews. Because the purpose of the ARS is to create a starting point for a school list, these factors are not yet relevant. Indeed, the ARS does not assess where an applicant will be accepted; rather, it determines the best collection of schools for the applicant to apply to maximize chances of success at the best schools realistically possible.
The following factors are taken into account by the ARS:
ARS Score = (Stats*5)+(Research*3)+(Clinical Experience [9, 5, -10])+(Shadowing [6, -5])+(Volunteering*2)+(Leadership and Teaching*2)+(Miscellaneous*3)+[(Undergrad-1)*3]+[(URM-1)*7]+[(Upward Trend-1)*4]
This score is then translated to one of 6 categories that applicants are grouped into, which are designated Levels S, A, B, C, D, E in decreasing score order. The score thresholds are as follows:
School Categories and Applicant Profiles
Schools are similarly grouped into 7 broad categories by basis of selectivity. The categories are as follows:
Category 1 (TOP): Harvard, Stanford, Hopkins, UCSF, Penn, WashU, Yale, Columbia, Duke, Chicago
Category 2 (HIGH): Michigan, UCLA*, NYU, Vanderbilt, Pitt, UCSD*, Cornell, Northwestern, Mt Sinai, Baylor*, Mayo, Case Western, Emory
Category 3 (MID): UTSW*, UVA, Ohio State, USC-Keck, Rochester, Dartmouth, Einstein, Hofstra, UNC*
Category 4 (LOW): USF-Morsani, Wayne State, Creighton, Oakland, SLU, Cincinnati, Indiana, Miami, Iowa, MC Wisconsin, Toledo, SUNY Downstate, Stony Brook, VCU, Western MI, EVMS, Vermont, WVU, Wisconsin, Quinnipiac, Wake Forest, Maryland
Category 5 (STATE): Your state schools if they do not appear elsewhere on this list - You should always apply to all of these if applying MD
Category 6 (LOW YIELD): Jefferson, Tulane, Tufts, Georgetown, Brown, BU, Loyola, Rosalind Franklin, Drexel, Commonwealth, Temple, GWU, NYMC, Penn State, Albany, Rush
Category 7 (DO): DO Schools
Application profiles give the total number of schools an applicant should apply to in addition to the % of each category that should make up the total. Table 1 shows the score ranges, percentage of schools by category, total number of schools, and whether or not the applicant should apply to Category 6 or 7 schools. State schools should always be applied to if the applicant is applying to any MD schools.
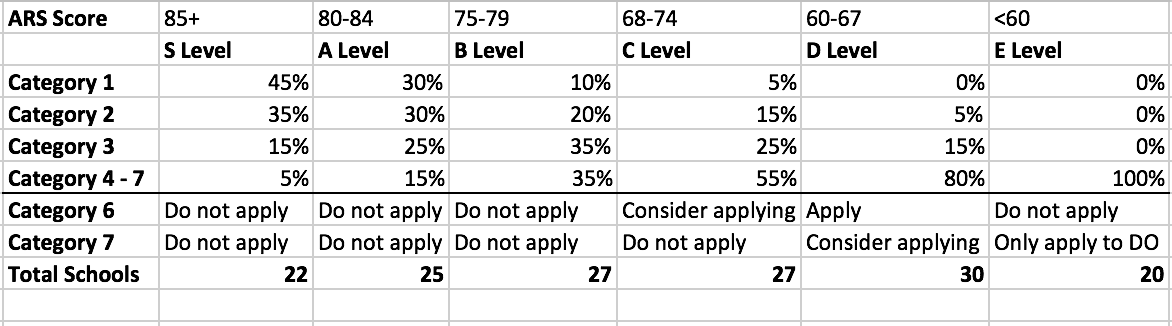
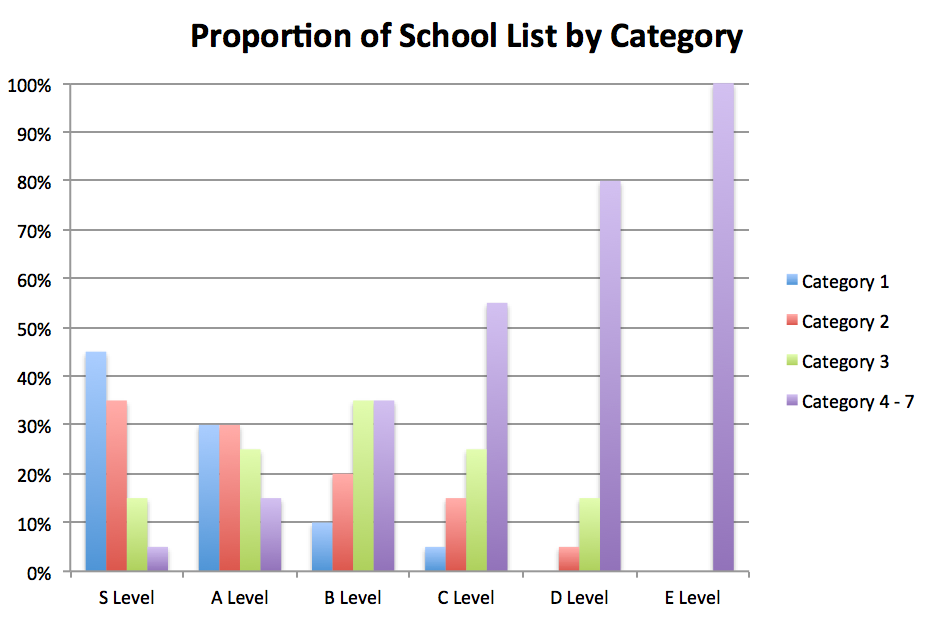
Figure 1 shows the proportion of school list by category for each applicant level. Note that Level E applicants should only be applying to DO schools, as shown in Table 1.
Scoring Methodology
This section will delineate each of the metrics used to score an applicant in all of the categories mentioned previously. The multiplier for the score will also be shown, as well as the score cap for the section.
Stats
Score Cap: 10
Multiplier: 5
The stats section is determined by a combination of MCAT and GPA. However, it is different from the LizzyM system in that scores are grouped into larger groups that then determines the Stats score for the applicant. This is because when using the LizzyM system, an applicant with a 2.9 and a 40 will be as competitive as someone with a 3.9 and a 30, while this is not true in practice (generally the latter will be more competitive). The LizzyM score appears to be less accurate at the extremes.
Table 2 shows how to determine an applicant's Stats score based on their MCAT and GPA. The number given in the table is the Stats score assigned.
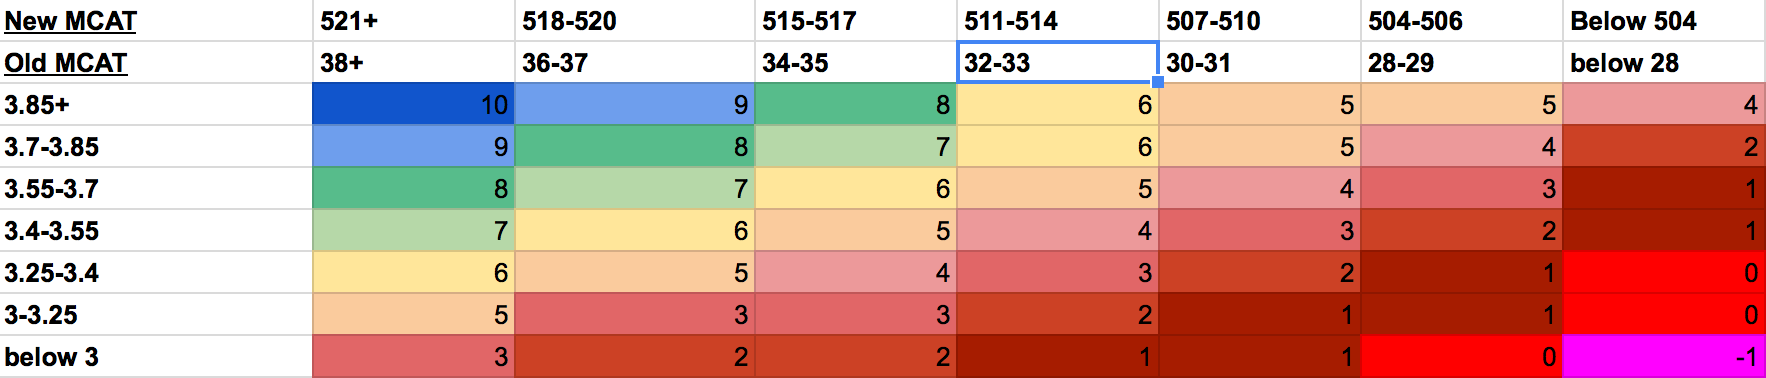
This table was developed by a combination of Tables 24/25 published by AMCAS that gives an applicant's chance of success with certain MCAT and GPA as well as by individually looking at how applicants with certain combinations of GPAs and MCATs fared. Median, 10th, and 90th percentile GPAs and MCATs for schools in each category were also looked at when compiling this chart. GPA is averaged over all applicable fields - undergraduate sGPA, undergraduate cGPA, post-bac GPA, graduate GPA.
Score conversion percentiles were taken from the old MCAT percentiles chart (2012-2014) and the new MCAT percentiles chart (2015). The percentage of the old MCAT score was used as the floor for the percentage for the new MCAT. So if 24 was 40th percentile, 25 was 42nd, 490 was 39th, 491 was 40th, and 492 was 41st, then 24 would correspond to 491-492.
Research Experience
Score Cap: 5
Multiplier: 3
Level 5: Significant, sustained research activity. Generally, applicants in this category will have a first author publication, publication in a high-impact journal, and/or solo presentation of their own, original work at a major conference. These are the research superstars who are performing work well beyond the level of an undergraduate. PhDs will generally fall into this category, too.
Level 4: Significant, sustained research activity, generally for at least 2 years. Applicants in this category may have a poster presentation, a middle author publication in a medium- or low-impact journal, an abstract, or a thesis. These applicants have a strong research focus and perform research above the level of the average undergraduate.
Level 3: Moderate research activity, generally for a year or more. These applicants generally don't have publications or presentations, but may have completed a project.
Level 2: Slight research activity, generally for less than a year.
Level 1: No research activity.
Clinical Experience
Note that clinical experience can be volunteer or non-volunteer experience.
Score Cap: 3
Multiplier: +9, +5, -10 (by Level)
Level 3: Significant, sustained clinical experience, generally for well over a year. These applicants have demonstrated a strong commitment to clinical endeavors and have exposure in a clinical setting well beyond the average applicant.
Level 2: Moderate clinical experience, generally for well under a year. These applicants have adequate/sufficient exposure to clinical activity.
Level 1: Slight or no clinical experience.
Shadowing
Score Cap: 2
Multiplier: +6, -5 (by Level)
Level 2: Adequate shadowing or greater
Level 1: Slight or no shadowing experience.
Volunteering
Note that this section takes into account both clinical and non-clinical volunteering.
Score Cap: 3
Multiplier: 2
Level 3: Significant, sustained volunteering activity, generally over a long period of time, in one or multiple organizations. May also be working with marginalized or disadvantaged groups or in uncomfortable settings.
Level 2: Some volunteering activity, generally with low-to-moderate levels of commitment or sustained activity.
Level 1: Slight or no volunteering experience.
Leadership and Teaching
Score Cap: 3
Multiplier: 2
Level 3: Sustained, significant teaching and/or leadership experience. This category includes applicants who teach grade school students, go on a teaching fellowship, have TA'd or tutored for long periods of time, are the head of a major organization, or have other equally demanding responsibilities.
Level 2: Some teaching and/or leadership experience, often with low-to-moderate levels of commitment or sustained activity.
Level 1: Slight or no leadership or teaching experience.
Miscellaneous
Score Cap: 4
Multiplier: 3
Level 4: Highly significant life experiences or achievements that are seen as outstanding and contribute maximally to personal and professional development. This may include Rhodes scholarships, world class musicianship, professional or Olympic athletics, significant or sustained meaningful or unique work experiences, or anything else outlandishly impressive.
Level 3: Moderately-to-highly significant life experiences or achievements. This includes other terminal graduate degrees such as PhDs or JDs, military or Peace Corp service, as well as intense involvement with a unique or meaningful non-medical activity.
Level 2: Minimal-to-moderate involvement in personal activity or work experience. This may include major personal hobbies or athletics, musicianship, or other experiences.
Level 1: Nothing else to add.
Undergraduate School
Score Cap: 3 (really 2, 1, 0, but that's taken into account in the formula already)
Multiplier: 3
Level 3: Harvard, Yale, Princeton, Stanford, MIT
Level 2: All other "prestigious" or highly selective schools including other Ivies, WashU, Duke, Hopkins, UChicago etc
Level 1: All other schools
Representation in Medicine
Score Cap: 2 (really 1, 0, but that's taken into account in the formula already)
Multiplier: 7
Level 2: Underrepresented in Medicine (URM)
Level 1: All other
GPA Trend
Score Cap: 2 (really 1, 0, but that's taken into account in the formula already)
Multiplier: 4
Level 2: Upward trend
Level 1: No upward trend
Discussion
There are a few problems associated with the ARS. First, it's tied mostly to MD applicants - it breaks down for people primarily applying to DO schools. It also doesn't have a real way to evaluate the competitiveness of MD/PhD applicants (or Lerner/Cleveland Clinic applicants). Second, it obviously does not take into account subjective factors such as how one talks about their experiences and it assumes that certain groups of applicants will be similar enough to group them based on an almost arbitrary cut-off (which could be contested). Finally, it does not have a great way of scoring people with multiple but very disparate GPAs (such as 2.9 undergraduate but 3.95 graduate).
Overall, this is just a tool for applicants to analyze themselves and figure out how to create a balanced school list that will offer them the optimal chance of success. I hope that it will not turn into a "check-box" machine where applicants will tailor their activities to try and "game" this system. Remember that it is not my system that is ultimately evaluating an application, it is a group of adcoms who do so through a process far more nuanced than this one. This is just a way to get an "at a glance" view of an application after it has been built. It is my hope that new applicants will use this system to help them construct a school list that is at the same time realistic and geared toward making them as successful an applicant as possible.
Latest version is 1.3 (Released January 2017)
Collaborator credit: @To be MD
Introduction
As some of you may have seen, I've recently been pioneering a new system that helps applicants figure out where they stand with respect to medical school admissions as well as giving them a place to start when it comes to creating a school list. My system is a comprehensive algorithm that takes into account all of the major (and some of the minor!) factors that go into building a successful application! This post aims to elucidate the process by which this method scores an applicant as well as get community input on the algorithm to attempt to strengthen it even more.
When I first started building this system, I used a google doc spreadsheet to make notes and create the initial versions of some of the formulas that go into this program. In order to do this, I scored myself, other applicants I knew in real life, and many applications I found in the What Are My Chances (WAMC) forum to adjust rating scales to try and create a generalized model that placed applicants into appropriate discrete categories.
Once I had my initial quantitative rating system in place, I wrote a Python script that allowed me to easily score an applicant based on factors normally included in their WAMC thread and which gives the output that I normally post in these threads. This is the point at which I started posting in threads as well to see how well my formulations matched up with community suggestions.
Finally, after some more tweaking, I created a comprehensive Excel document that contains instructions, qualitative descriptions of each factor that are then reduced to a numerical score, a place to input score values and receive a score in addition to a category level and school breakdown, and a page that displays which schools are in which categories. This document is available for download.
I will go through each of these factors in this post to articulate how they fit into the overall scoring paradigm as well as solicit input from the SDN community about how to increase the accuracy of this system.
The LizzyM System
This system was originally created as a supplement to, not a replacement for, the already widely-utilized LizzyM scoring system. As a reference, the LizzyM score is defined as (GPA*10)+MCAT and may contain a +1 or -1 modifier in certain situations. The applicant's LizzyM score is then compared to the LizzyM score for a school to determine whether or not the applicant is statistically competitive for that school. However, the inherent simplicity of the LizzyM score, while making it quick and easy to generate and apply, also creates problems endemic to systems that reduce and generalize. The two major simplifications are the reduction of an entire application to two (already numerical) metrics and the assumption that the LizzyM score accounts for the majority of, if not all of, the variability attributed to selectivity.
While there is merit to these assumptions, which is why the LizzyM score is so widely used, there are also deficiencies that need to be addressed in order to create a more accurate system for assessing an application. One of these deficiencies is that certain schools with similar LizzyM schools may be in very different levels of competitiveness. For example, although UVA and Duke have identical LizzyM scores, it is clear that Duke is a much more selective school than UVA. Additionally, small differences in LizzyM score become significant when using this metric to assess competitiveness for two similar schools. For example, Duke has a LizzyM score of 75, while Yale has a LizzyM score of 76; both schools are similarly selective, but someone might (very mistakenly) advise a applicant with a 3.9/36 that they are more competitive for Duke than they are for Yale. Finally, the LizzyM score is used as a way to tell if someone is statistically competitive for a single school and is significantly less useful for helping an applicant come up with a list of schools.
The Applicant Rating System - Overview
The WedgeDawg Applicant Rating System (ARS) was created to address these deficiencies. It takes into account most of the factors that make up an application to medical school, gives an applicant a separate score for each one, and then gives an applicant a numerical rating. This numerical rating is then translated to a category level and a profile of schools to apply to is created based on that category.
One of the major assumptions of the ARS is that applicants can be broadly classified in terms of competitiveness into one of 6 categories. Within these categories, distinctions between applicants are might lower than the differences between applicants that are in separate groups. Much of the variability that occurs between two applicants in the same group comes from subjective parts of the application that are not taken into account here, namely the personal statement, letters of recommendation, secondary essays, and their interviews. Because the purpose of the ARS is to create a starting point for a school list, these factors are not yet relevant. Indeed, the ARS does not assess where an applicant will be accepted; rather, it determines the best collection of schools for the applicant to apply to maximize chances of success at the best schools realistically possible.
The following factors are taken into account by the ARS:
- GPA
- MCAT
- Research
- Clinical Experience
- Shadowing
- Volunteering
- Leadership and Teaching
- Miscellaneous
- Undergraduate School
- Representation in Medicine
- GPA Trend
ARS Score = (Stats*5)+(Research*3)+(Clinical Experience [9, 5, -10])+(Shadowing [6, -5])+(Volunteering*2)+(Leadership and Teaching*2)+(Miscellaneous*3)+[(Undergrad-1)*3]+[(URM-1)*7]+[(Upward Trend-1)*4]
This score is then translated to one of 6 categories that applicants are grouped into, which are designated Levels S, A, B, C, D, E in decreasing score order. The score thresholds are as follows:
- Level S: 85
- Level A: 80
- Level B: 75
- Level C: 68
- Level D: 60
- Level E: 0
School Categories and Applicant Profiles
Schools are similarly grouped into 7 broad categories by basis of selectivity. The categories are as follows:
Category 1 (TOP): Harvard, Stanford, Hopkins, UCSF, Penn, WashU, Yale, Columbia, Duke, Chicago
Category 2 (HIGH): Michigan, UCLA*, NYU, Vanderbilt, Pitt, UCSD*, Cornell, Northwestern, Mt Sinai, Baylor*, Mayo, Case Western, Emory
Category 3 (MID): UTSW*, UVA, Ohio State, USC-Keck, Rochester, Dartmouth, Einstein, Hofstra, UNC*
Category 4 (LOW): USF-Morsani, Wayne State, Creighton, Oakland, SLU, Cincinnati, Indiana, Miami, Iowa, MC Wisconsin, Toledo, SUNY Downstate, Stony Brook, VCU, Western MI, EVMS, Vermont, WVU, Wisconsin, Quinnipiac, Wake Forest, Maryland
Category 5 (STATE): Your state schools if they do not appear elsewhere on this list - You should always apply to all of these if applying MD
Category 6 (LOW YIELD): Jefferson, Tulane, Tufts, Georgetown, Brown, BU, Loyola, Rosalind Franklin, Drexel, Commonwealth, Temple, GWU, NYMC, Penn State, Albany, Rush
Category 7 (DO): DO Schools
Application profiles give the total number of schools an applicant should apply to in addition to the % of each category that should make up the total. Table 1 shows the score ranges, percentage of schools by category, total number of schools, and whether or not the applicant should apply to Category 6 or 7 schools. State schools should always be applied to if the applicant is applying to any MD schools.
Figure 1 shows the proportion of school list by category for each applicant level. Note that Level E applicants should only be applying to DO schools, as shown in Table 1.
Scoring Methodology
This section will delineate each of the metrics used to score an applicant in all of the categories mentioned previously. The multiplier for the score will also be shown, as well as the score cap for the section.
Stats
Score Cap: 10
Multiplier: 5
The stats section is determined by a combination of MCAT and GPA. However, it is different from the LizzyM system in that scores are grouped into larger groups that then determines the Stats score for the applicant. This is because when using the LizzyM system, an applicant with a 2.9 and a 40 will be as competitive as someone with a 3.9 and a 30, while this is not true in practice (generally the latter will be more competitive). The LizzyM score appears to be less accurate at the extremes.
Table 2 shows how to determine an applicant's Stats score based on their MCAT and GPA. The number given in the table is the Stats score assigned.
This table was developed by a combination of Tables 24/25 published by AMCAS that gives an applicant's chance of success with certain MCAT and GPA as well as by individually looking at how applicants with certain combinations of GPAs and MCATs fared. Median, 10th, and 90th percentile GPAs and MCATs for schools in each category were also looked at when compiling this chart. GPA is averaged over all applicable fields - undergraduate sGPA, undergraduate cGPA, post-bac GPA, graduate GPA.
Score conversion percentiles were taken from the old MCAT percentiles chart (2012-2014) and the new MCAT percentiles chart (2015). The percentage of the old MCAT score was used as the floor for the percentage for the new MCAT. So if 24 was 40th percentile, 25 was 42nd, 490 was 39th, 491 was 40th, and 492 was 41st, then 24 would correspond to 491-492.
Research Experience
Score Cap: 5
Multiplier: 3
Level 5: Significant, sustained research activity. Generally, applicants in this category will have a first author publication, publication in a high-impact journal, and/or solo presentation of their own, original work at a major conference. These are the research superstars who are performing work well beyond the level of an undergraduate. PhDs will generally fall into this category, too.
Level 4: Significant, sustained research activity, generally for at least 2 years. Applicants in this category may have a poster presentation, a middle author publication in a medium- or low-impact journal, an abstract, or a thesis. These applicants have a strong research focus and perform research above the level of the average undergraduate.
Level 3: Moderate research activity, generally for a year or more. These applicants generally don't have publications or presentations, but may have completed a project.
Level 2: Slight research activity, generally for less than a year.
Level 1: No research activity.
Clinical Experience
Note that clinical experience can be volunteer or non-volunteer experience.
Score Cap: 3
Multiplier: +9, +5, -10 (by Level)
Level 3: Significant, sustained clinical experience, generally for well over a year. These applicants have demonstrated a strong commitment to clinical endeavors and have exposure in a clinical setting well beyond the average applicant.
Level 2: Moderate clinical experience, generally for well under a year. These applicants have adequate/sufficient exposure to clinical activity.
Level 1: Slight or no clinical experience.
Shadowing
Score Cap: 2
Multiplier: +6, -5 (by Level)
Level 2: Adequate shadowing or greater
Level 1: Slight or no shadowing experience.
Volunteering
Note that this section takes into account both clinical and non-clinical volunteering.
Score Cap: 3
Multiplier: 2
Level 3: Significant, sustained volunteering activity, generally over a long period of time, in one or multiple organizations. May also be working with marginalized or disadvantaged groups or in uncomfortable settings.
Level 2: Some volunteering activity, generally with low-to-moderate levels of commitment or sustained activity.
Level 1: Slight or no volunteering experience.
Leadership and Teaching
Score Cap: 3
Multiplier: 2
Level 3: Sustained, significant teaching and/or leadership experience. This category includes applicants who teach grade school students, go on a teaching fellowship, have TA'd or tutored for long periods of time, are the head of a major organization, or have other equally demanding responsibilities.
Level 2: Some teaching and/or leadership experience, often with low-to-moderate levels of commitment or sustained activity.
Level 1: Slight or no leadership or teaching experience.
Miscellaneous
Score Cap: 4
Multiplier: 3
Level 4: Highly significant life experiences or achievements that are seen as outstanding and contribute maximally to personal and professional development. This may include Rhodes scholarships, world class musicianship, professional or Olympic athletics, significant or sustained meaningful or unique work experiences, or anything else outlandishly impressive.
Level 3: Moderately-to-highly significant life experiences or achievements. This includes other terminal graduate degrees such as PhDs or JDs, military or Peace Corp service, as well as intense involvement with a unique or meaningful non-medical activity.
Level 2: Minimal-to-moderate involvement in personal activity or work experience. This may include major personal hobbies or athletics, musicianship, or other experiences.
Level 1: Nothing else to add.
Undergraduate School
Score Cap: 3 (really 2, 1, 0, but that's taken into account in the formula already)
Multiplier: 3
Level 3: Harvard, Yale, Princeton, Stanford, MIT
Level 2: All other "prestigious" or highly selective schools including other Ivies, WashU, Duke, Hopkins, UChicago etc
Level 1: All other schools
Representation in Medicine
Score Cap: 2 (really 1, 0, but that's taken into account in the formula already)
Multiplier: 7
Level 2: Underrepresented in Medicine (URM)
Level 1: All other
GPA Trend
Score Cap: 2 (really 1, 0, but that's taken into account in the formula already)
Multiplier: 4
Level 2: Upward trend
Level 1: No upward trend
Discussion
There are a few problems associated with the ARS. First, it's tied mostly to MD applicants - it breaks down for people primarily applying to DO schools. It also doesn't have a real way to evaluate the competitiveness of MD/PhD applicants (or Lerner/Cleveland Clinic applicants). Second, it obviously does not take into account subjective factors such as how one talks about their experiences and it assumes that certain groups of applicants will be similar enough to group them based on an almost arbitrary cut-off (which could be contested). Finally, it does not have a great way of scoring people with multiple but very disparate GPAs (such as 2.9 undergraduate but 3.95 graduate).
Overall, this is just a tool for applicants to analyze themselves and figure out how to create a balanced school list that will offer them the optimal chance of success. I hope that it will not turn into a "check-box" machine where applicants will tailor their activities to try and "game" this system. Remember that it is not my system that is ultimately evaluating an application, it is a group of adcoms who do so through a process far more nuanced than this one. This is just a way to get an "at a glance" view of an application after it has been built. It is my hope that new applicants will use this system to help them construct a school list that is at the same time realistic and geared toward making them as successful an applicant as possible.
Attachments
Last edited:
")

