- Joined
- May 26, 2015
- Messages
- 48
- Reaction score
- 1
(see attachment)
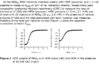
I understand that there is a one to one ratio based on the graphs. First of all, what do the different graphs represent? I was a little confused.
And my other question about this passage is, if it is a one to one ratio, what is the significance of stating that 25 injections of NAG3 were used, because in my initial working of this problem, I was going to use the data from the injections (10microL, 2.5 mM).
Any help appreciated, Thanks!