- Joined
- Apr 6, 2014
- Messages
- 14,146
- Reaction score
- 22,791
AAMC Tables A-19 and A-20 provide some interesting information: the average applicant and matriculant MCAT per state, and the Standard Deviation for each.
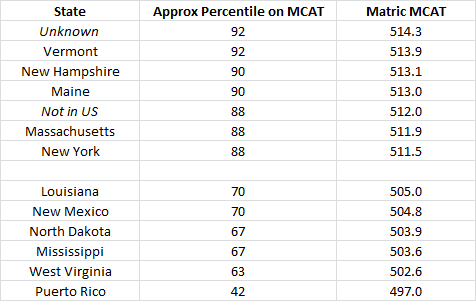
Right away you can take a glance to see who has the highest and lowest matriculant MCATs relative to the overall pool of test takers:

But, states also vary greatly in the average MCATs of their applicants. So what about the position of an average matriculant within their state's own applicant pool?
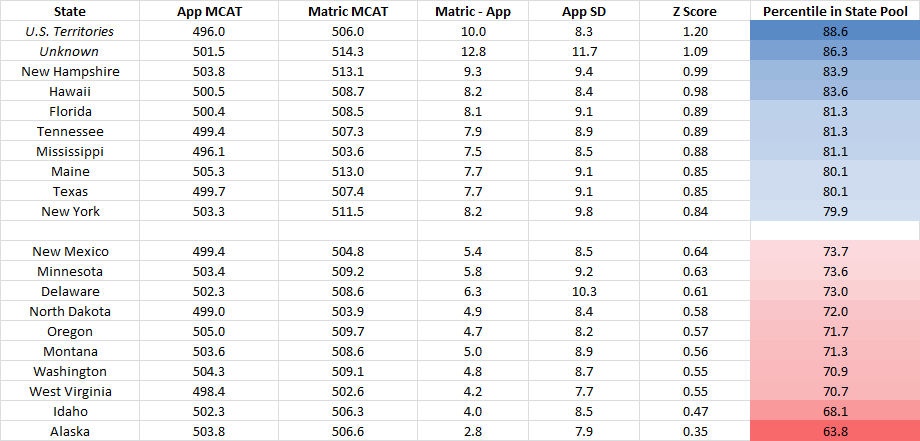
By finding the Matric - App difference in each state, dividing by the state's standard deviation for applicants, and using the NORMSDIST function in Excel, you can quickly find the z-score and percentile of the average matriculant relative to the applicant population of just their own state.
So, by state, who tends to matriculate the highest scoring of their pool? Top and bottom below, and full table here.

Edit: To clarify what this chart shows: Pick a state, say Idaho. The average Idaho resident that got into medical school outscored 68% of other Idaho residents. Compare to Hawaii - the average Hawaiian that got admitted outscored 84% of other Hawaiian applicants.
I find this pretty interesting! I would not have guessed, for example, that the average Maine and Mississippi matriculants actually beat about the same portion of their own states' applicants.
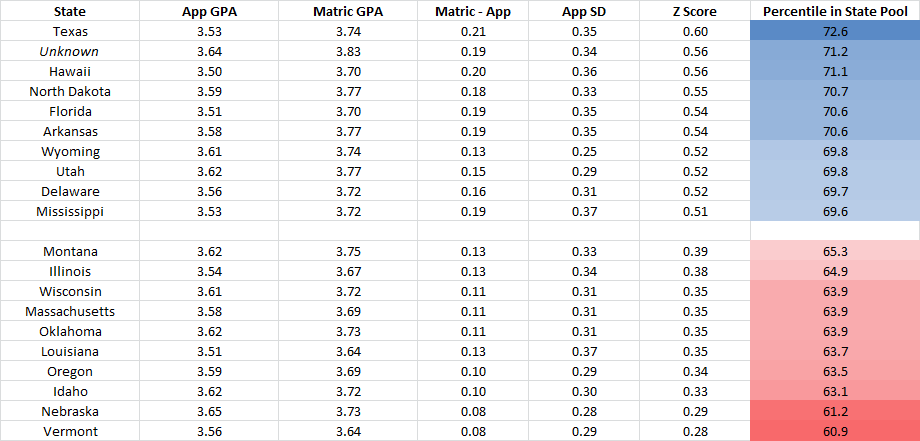
Bonus by region, top sorted by Matric MCAT and bottom by percentile among own region:


Right away you can take a glance to see who has the highest and lowest matriculant MCATs relative to the overall pool of test takers:

But, states also vary greatly in the average MCATs of their applicants. So what about the position of an average matriculant within their state's own applicant pool?
By finding the Matric - App difference in each state, dividing by the state's standard deviation for applicants, and using the NORMSDIST function in Excel, you can quickly find the z-score and percentile of the average matriculant relative to the applicant population of just their own state.
So, by state, who tends to matriculate the highest scoring of their pool? Top and bottom below, and full table here.

Edit: To clarify what this chart shows: Pick a state, say Idaho. The average Idaho resident that got into medical school outscored 68% of other Idaho residents. Compare to Hawaii - the average Hawaiian that got admitted outscored 84% of other Hawaiian applicants.
I find this pretty interesting! I would not have guessed, for example, that the average Maine and Mississippi matriculants actually beat about the same portion of their own states' applicants.
Bonus by region, top sorted by Matric MCAT and bottom by percentile among own region:


Last edited:


