- Joined
- Dec 17, 2007
- Messages
- 3,390
- Reaction score
- 4,403
Do.
Not.
Show.
This.
Trial.
To.
Your.
Medical.
Oncologist.

Do.
Not.
Show.
This.
Trial.
To.
Your.
Medical.
Oncologist.
Do.
Not.
Show.
This.
Trial.
To.
Your.
Medical.
Oncologist.
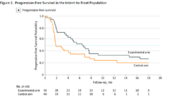
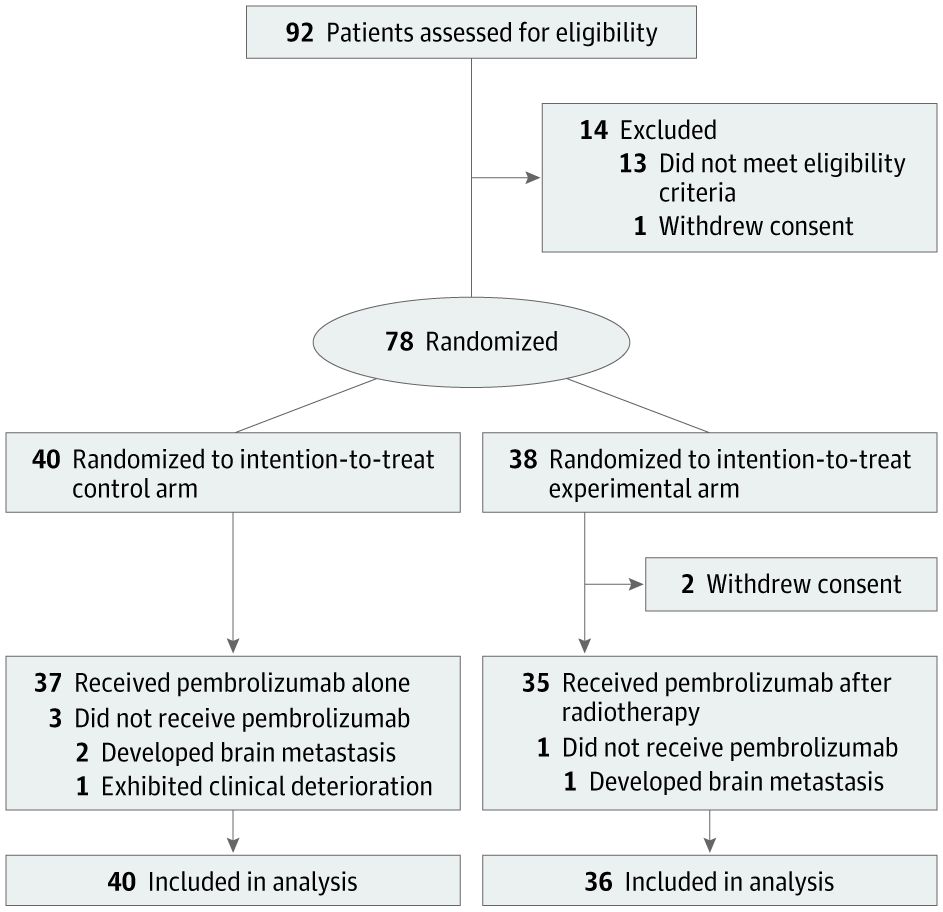
Seriously. They see a negative trial. I see a 500% increase in OS at 2-years.Not sure that I ever bought abscopal effect as an actionable thing. (I'm sure it's real but maybe just exceptional.) However, how do you have 12/45 patients in the experimental arm remaining at risk at 20 months compared to 4/51 in the standard arm and not have a real effect going on? Are they censoring the patients in some weird way or was there a stagger in enrollment for the different arms?
I disagree… most would see this as a positive trial 😂!Seriously. They see a negative trial. I see a 500% increase in OS at 2-years.
But this is a radiation trial. You have to adjust your standards. If it were a drug, it'd be a multi-billion dollar per year boon to some pharma company.I disagree… most would see this as a positive trial 😂!
I agree, I’m just saying the idea now is to take our modality out the equation whether if it’s from other fields or from our own.But this is a radiation trial. You have to adjust your standards. If it were a drug, it'd be a multi-billion dollar per year boon to some pharma company.
Radiation? This just proves it sucks.
Do.
Not.
Show.
This.
Trial.
To.
Your.
Medical.
Oncologist.
Seriously. They see a negative trial. I see a 500% increase in OS at 2-years.
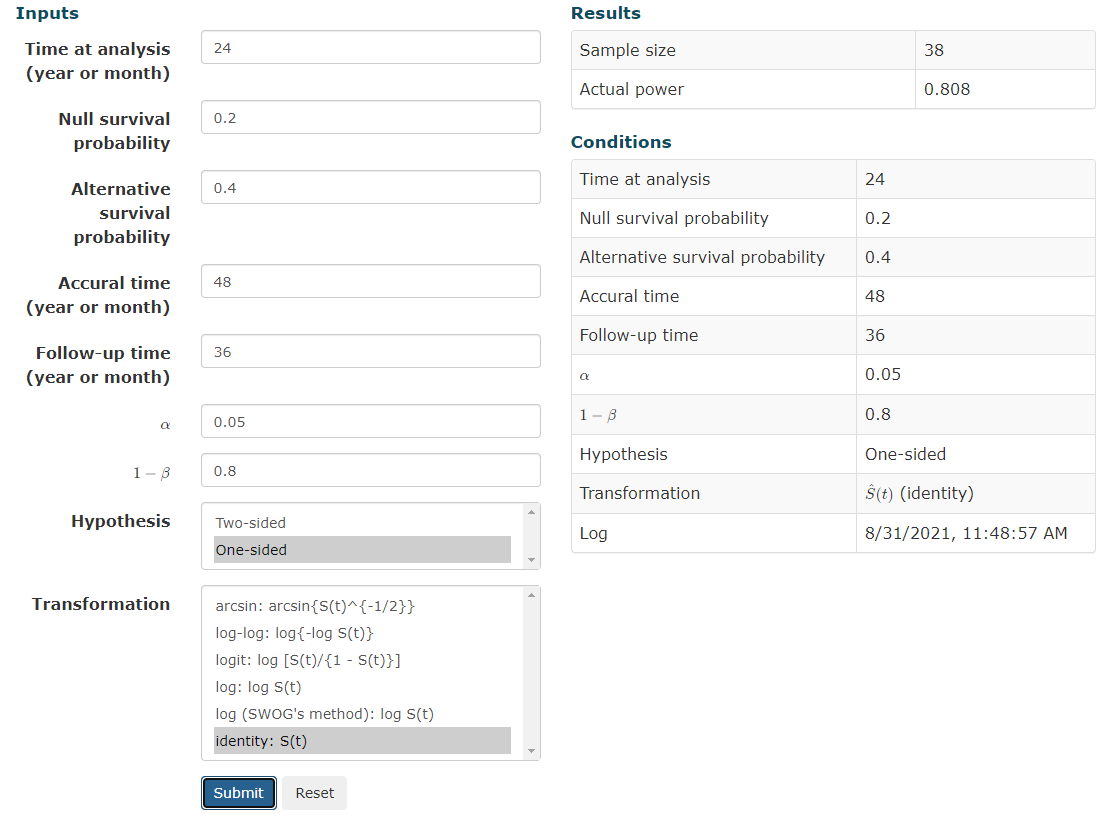
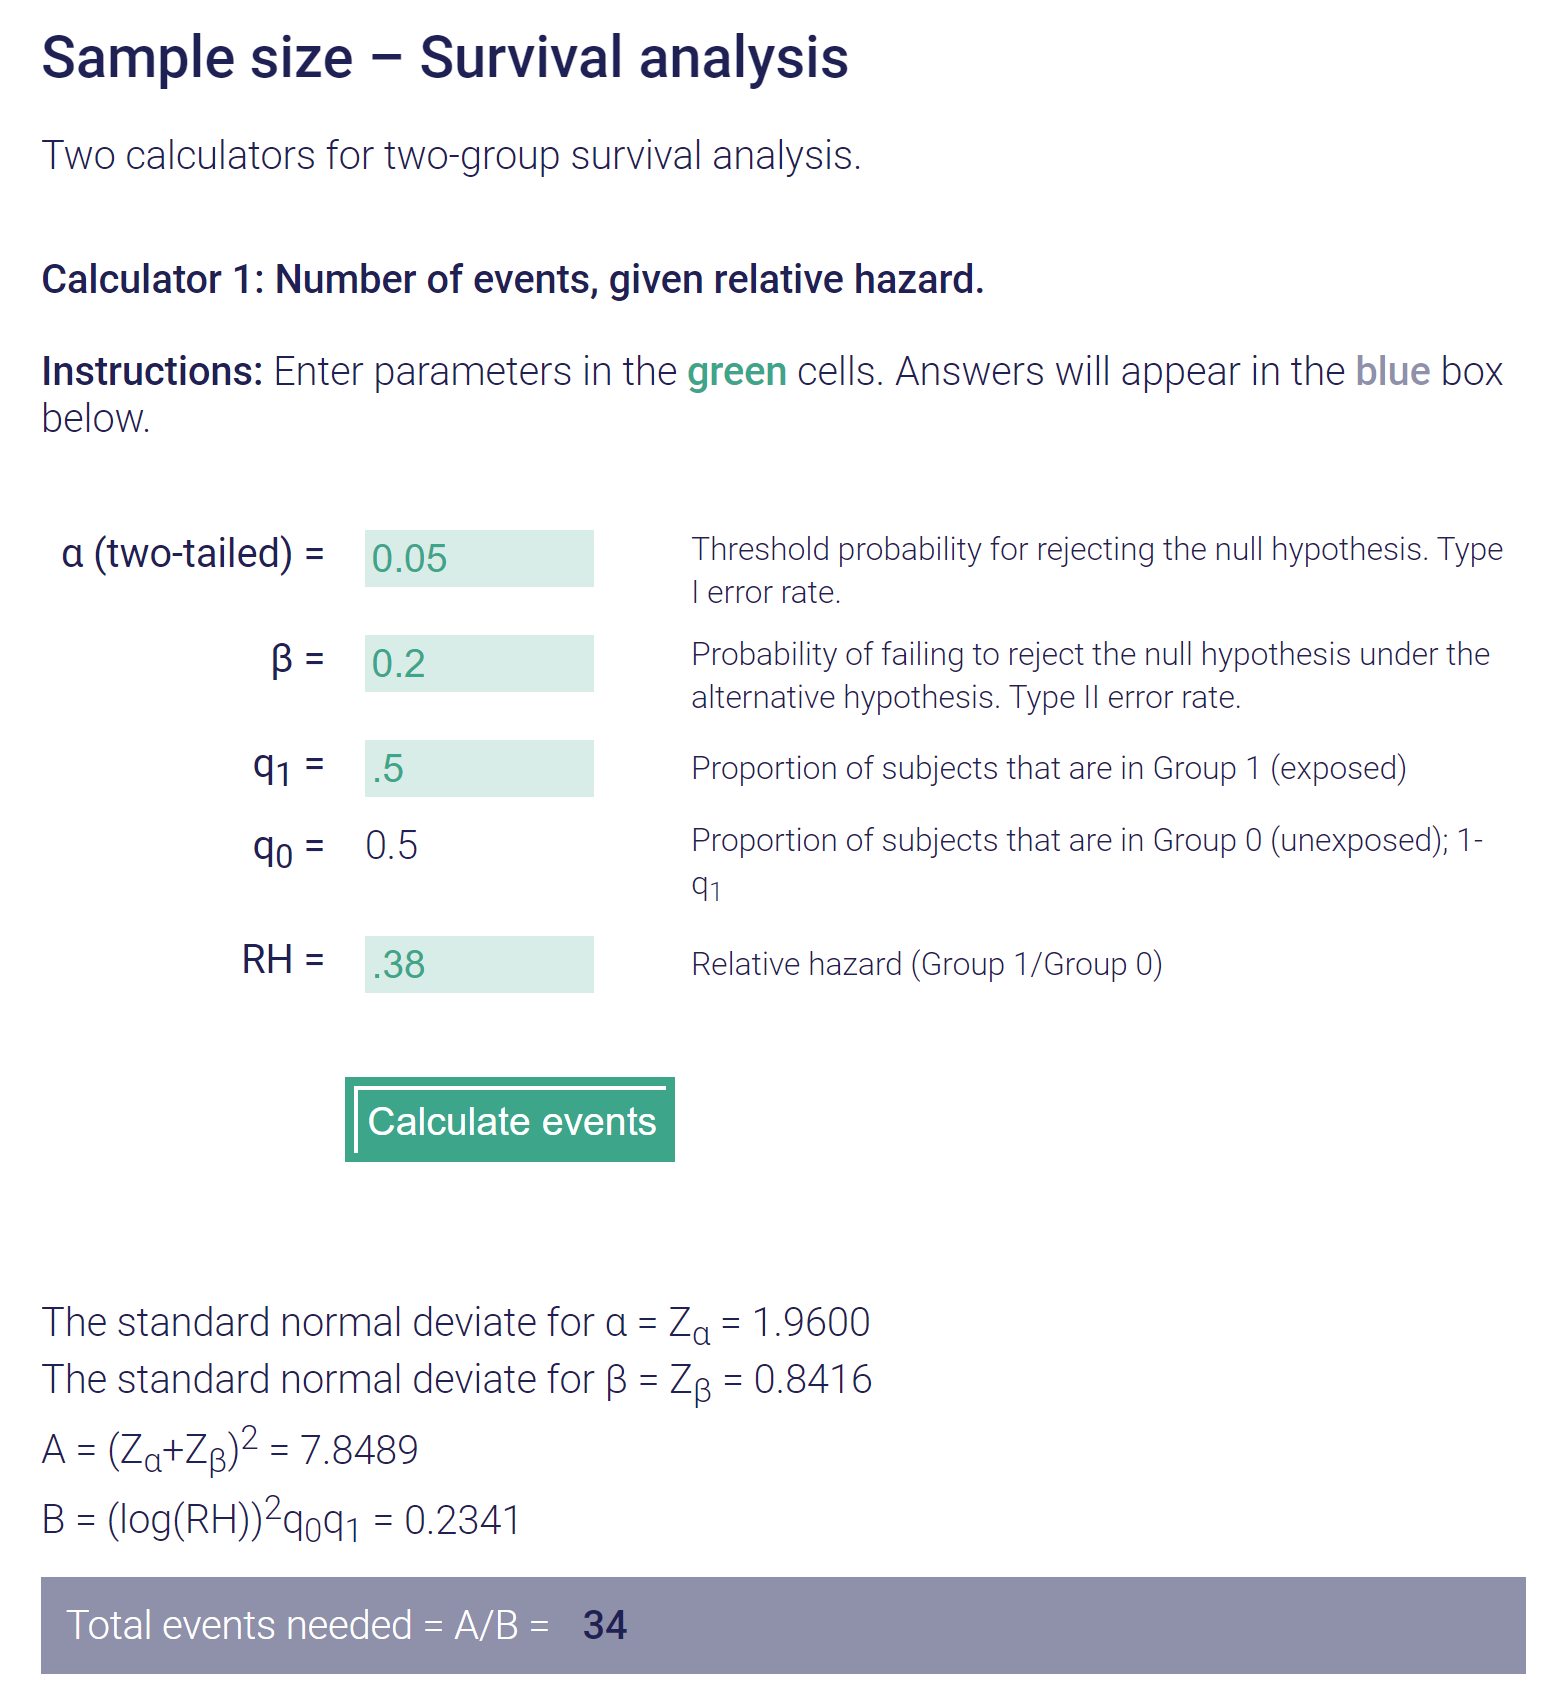
Yes. Agree with all of that. My comment was a bit tongue in cheek.I hate small trials. I mean plug in some numbers into a sample size calculator. Lets assume something very bold like SBRT in this setting will provide a 20% absolute survival benefit (from 20% to 40% surviving at 2 years). You would need a sample size of 162 to reduce your risk of Type 1 error to 5% with 80% power or 20% chance of missing true signal.
Post-hoc power calc on something like this gives power of ~57%. That means a 43% likelihood of missing even a crazy big effect.
Oh well. Not like COMET stats all that great. Worst part is that people are always congratulated on their work and negative small trials very damaging (as are positive ones).
I understand that it is hard to do a trial.
"That don't sound right." Pre-hoc, expecting a doubling of 2y OS from 20 to 40%... With a difference that big (the median OS is probably nigh double too) you wouldn't need ~80 patients in each arm to "catch the signal" via KM analysis.I hate small trials. I mean plug in some numbers into a sample size calculator. Lets assume something very bold like SBRT in this setting will provide a 20% absolute survival benefit (from 20% to 40% surviving at 2 years). You would need a sample size of 162 to reduce your risk of Type 1 error to 5% with 80% power or 20% chance of missing true signal.
Post-hoc power calc on something like this gives power of ~57%. That means a 43% likelihood of missing even a crazy big effect.
"That don't sound right." Pre-hoc, expecting a doubling of 2y OS from 20 to 40%... With a difference that big (the median OS is probably nigh double too) you wouldn't need ~80 patients in each arm to "catch the signal" via KM analysis.
EDIT: simple S(t) more appropriate
That's not for a non-parametric actuarial analysis though; this is for coin flipping type analyses
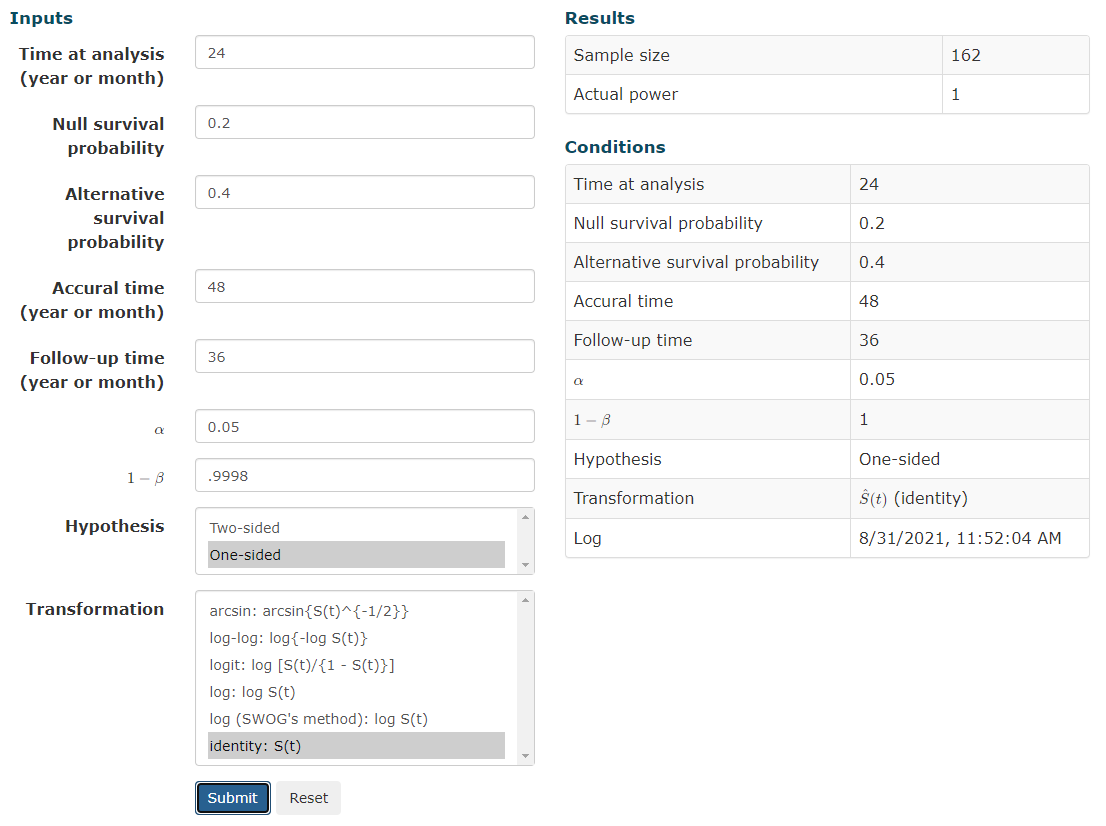
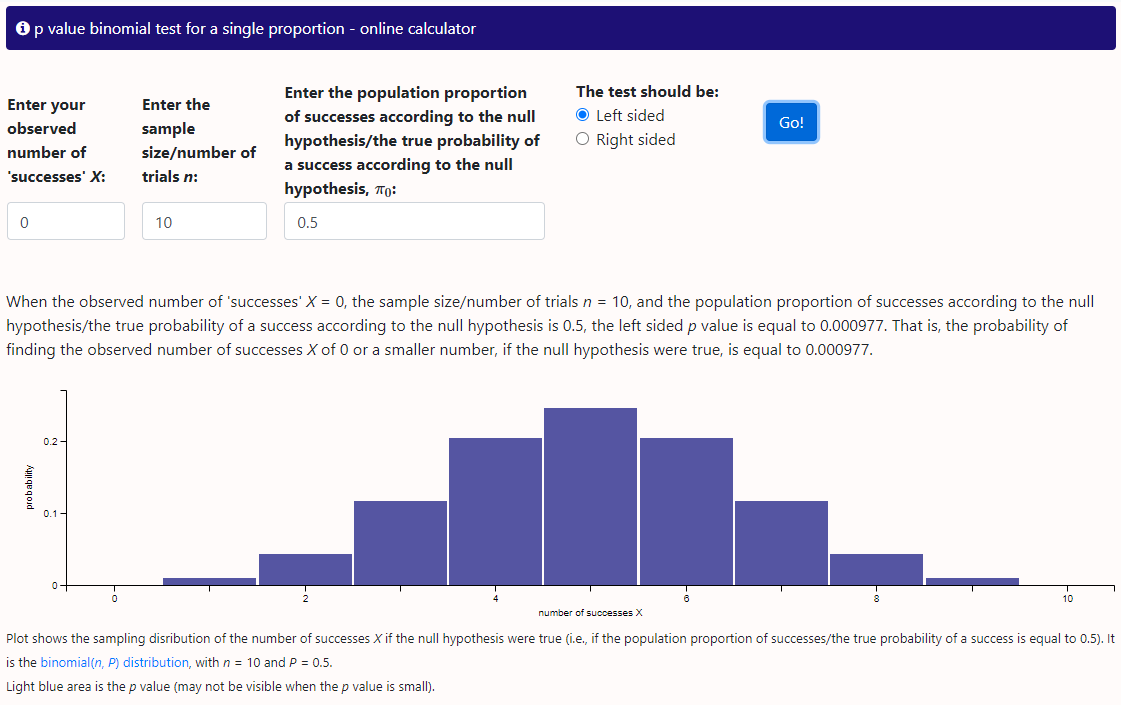
I'm using a simple sample size calc but I find it unbelievable that a sample of 20 with a null survival probability of 0.2 going to give you anything. This is expecting 4 vs. 8 survivors at a given time point, actually less than the difference in evaluable patients in this trial at the 2 year time point and claiming that in a population with significant variance in life expectancy that these numbers are meaningful."That don't sound right." Pre-hoc, expecting a doubling of 2y OS from 20 to 40%... With a difference that big (the median OS is probably nigh double too) you wouldn't need ~80 patients in each arm to "catch the signal" via KM analysis.
Source Chapter 7, page 179 Perez and Brady Second Edition (yeah I am old)That's not for a non-parametric actuarial analysis though; this is for coin flipping type analyses
(Specifically, we want the instantaneous survival function of one group vs another at 2 years; not a binary 20% probability vs 40% probability of yes/no alive at 2y... it's quite different math)
What is "meaningful."I'm using a simple sample size calc but I find it unbelievable that a sample of 20 with a null survival probability of 0.2 going to give you anything. This is expecting 4 vs. 8 survivors at a given time point, actually less than the difference in evaluable patients in this trial at the 2 year time point and claiming that in a population with significant variance in life expectancy that these numbers are meaningful.
Seems like I'm missing something big.
Are you sure that you are not calculating the sample size at the time point in question (for instance ~40 patients left at 2 years to evaluate)?
Seems like fake news! Consult your local biostatistician.Source Chapter 7, page 179 Perez and Brady Second Edition (yeah I am old)
Table 7-4
Patients required to Detect Improvement in Survival over Baseline Survival
Control Arm 20%
Experimental Arm 40%
Alpha=0.05
1-Beta=0.80
n=150
Alpha=0.05
1-Beta=0.90
n=200
????
Seems like fake news! Consult your local biostatistician.
Um yeah. I guess this is getting Bayesian but if we expect an equally weighted coin (which we usually do), not that rare to get 10 heads in a row but damn rare to get 100 and the larger the sample the closer it approximates the true odds of heads.I flip it 10 times (N=10) and get 10 heads. Do I need to do more coin flips to get a more meaningful result?
Seems like fake news! Consult your local biostatistician.
 clincalc.com
I just consult the Google
Sample Size Calculator
Calculator to determine the minimum number of subjects to enroll in a study for adequate power.
Bingo! you are running a simulation not calculating a sample size necessary to account for variability in real outcomes."knowing" a priori the outcome
Eh? Sample size calcs always have to make assumptions. "Lets assume something very bold like SBRT in this setting will provide a 20% absolute survival benefit (from 20% to 40% surviving at 2 years)."Sample size estimates make no a priori assumptions
I think you are missing the point. You have performed the experiment as if you knew the result. Assumptions for sample size are based on estimates. We cannot know what the results before the experiment.Eh? Sample size calcs always have to make assumptions.
If we "assume" the experimental arm will have 2y OS of 40% vs 20% for the control, we do not need 160 patients for a 0.8 power in a time failure analysis.
Think of what the p-value would be on these curves if the N were 160 instead of 39.
")
I guess you know more than all the cooperative groups that do Phase III trials with control of 20% and experimental of 40% that enroll 175-250 patients. To think we could do these studies with only two dozen patients.If you do a sample size calc *correctly* for 2y OS of 20% vs 40%, the answer is *not* 160. That is the take home message for today
Sample size calculation for one sample non-parametric survival (survival proportion) | Kengo Nagashima - Keio University
Sample size calculation for one sample non-parametric survival (survival proportion)nshi.jp
when differences are that big
You saidIf you do a sample size calc *correctly* for 2y OS of 20% vs 40%, the answer is *not* 160. That is the take home message for today
I think we all have done enough survival (LC, DFS, etc) analyses to know when differences are that big, we usually find a significant result with less than 100 patients.
This doesn't lessen communitydoc's greater point: that increasing sample sizes to find differences *just in case* one is there we would like to find is laudable.
"I think you are missing the point. You have performed the experiment as if you knew the result."
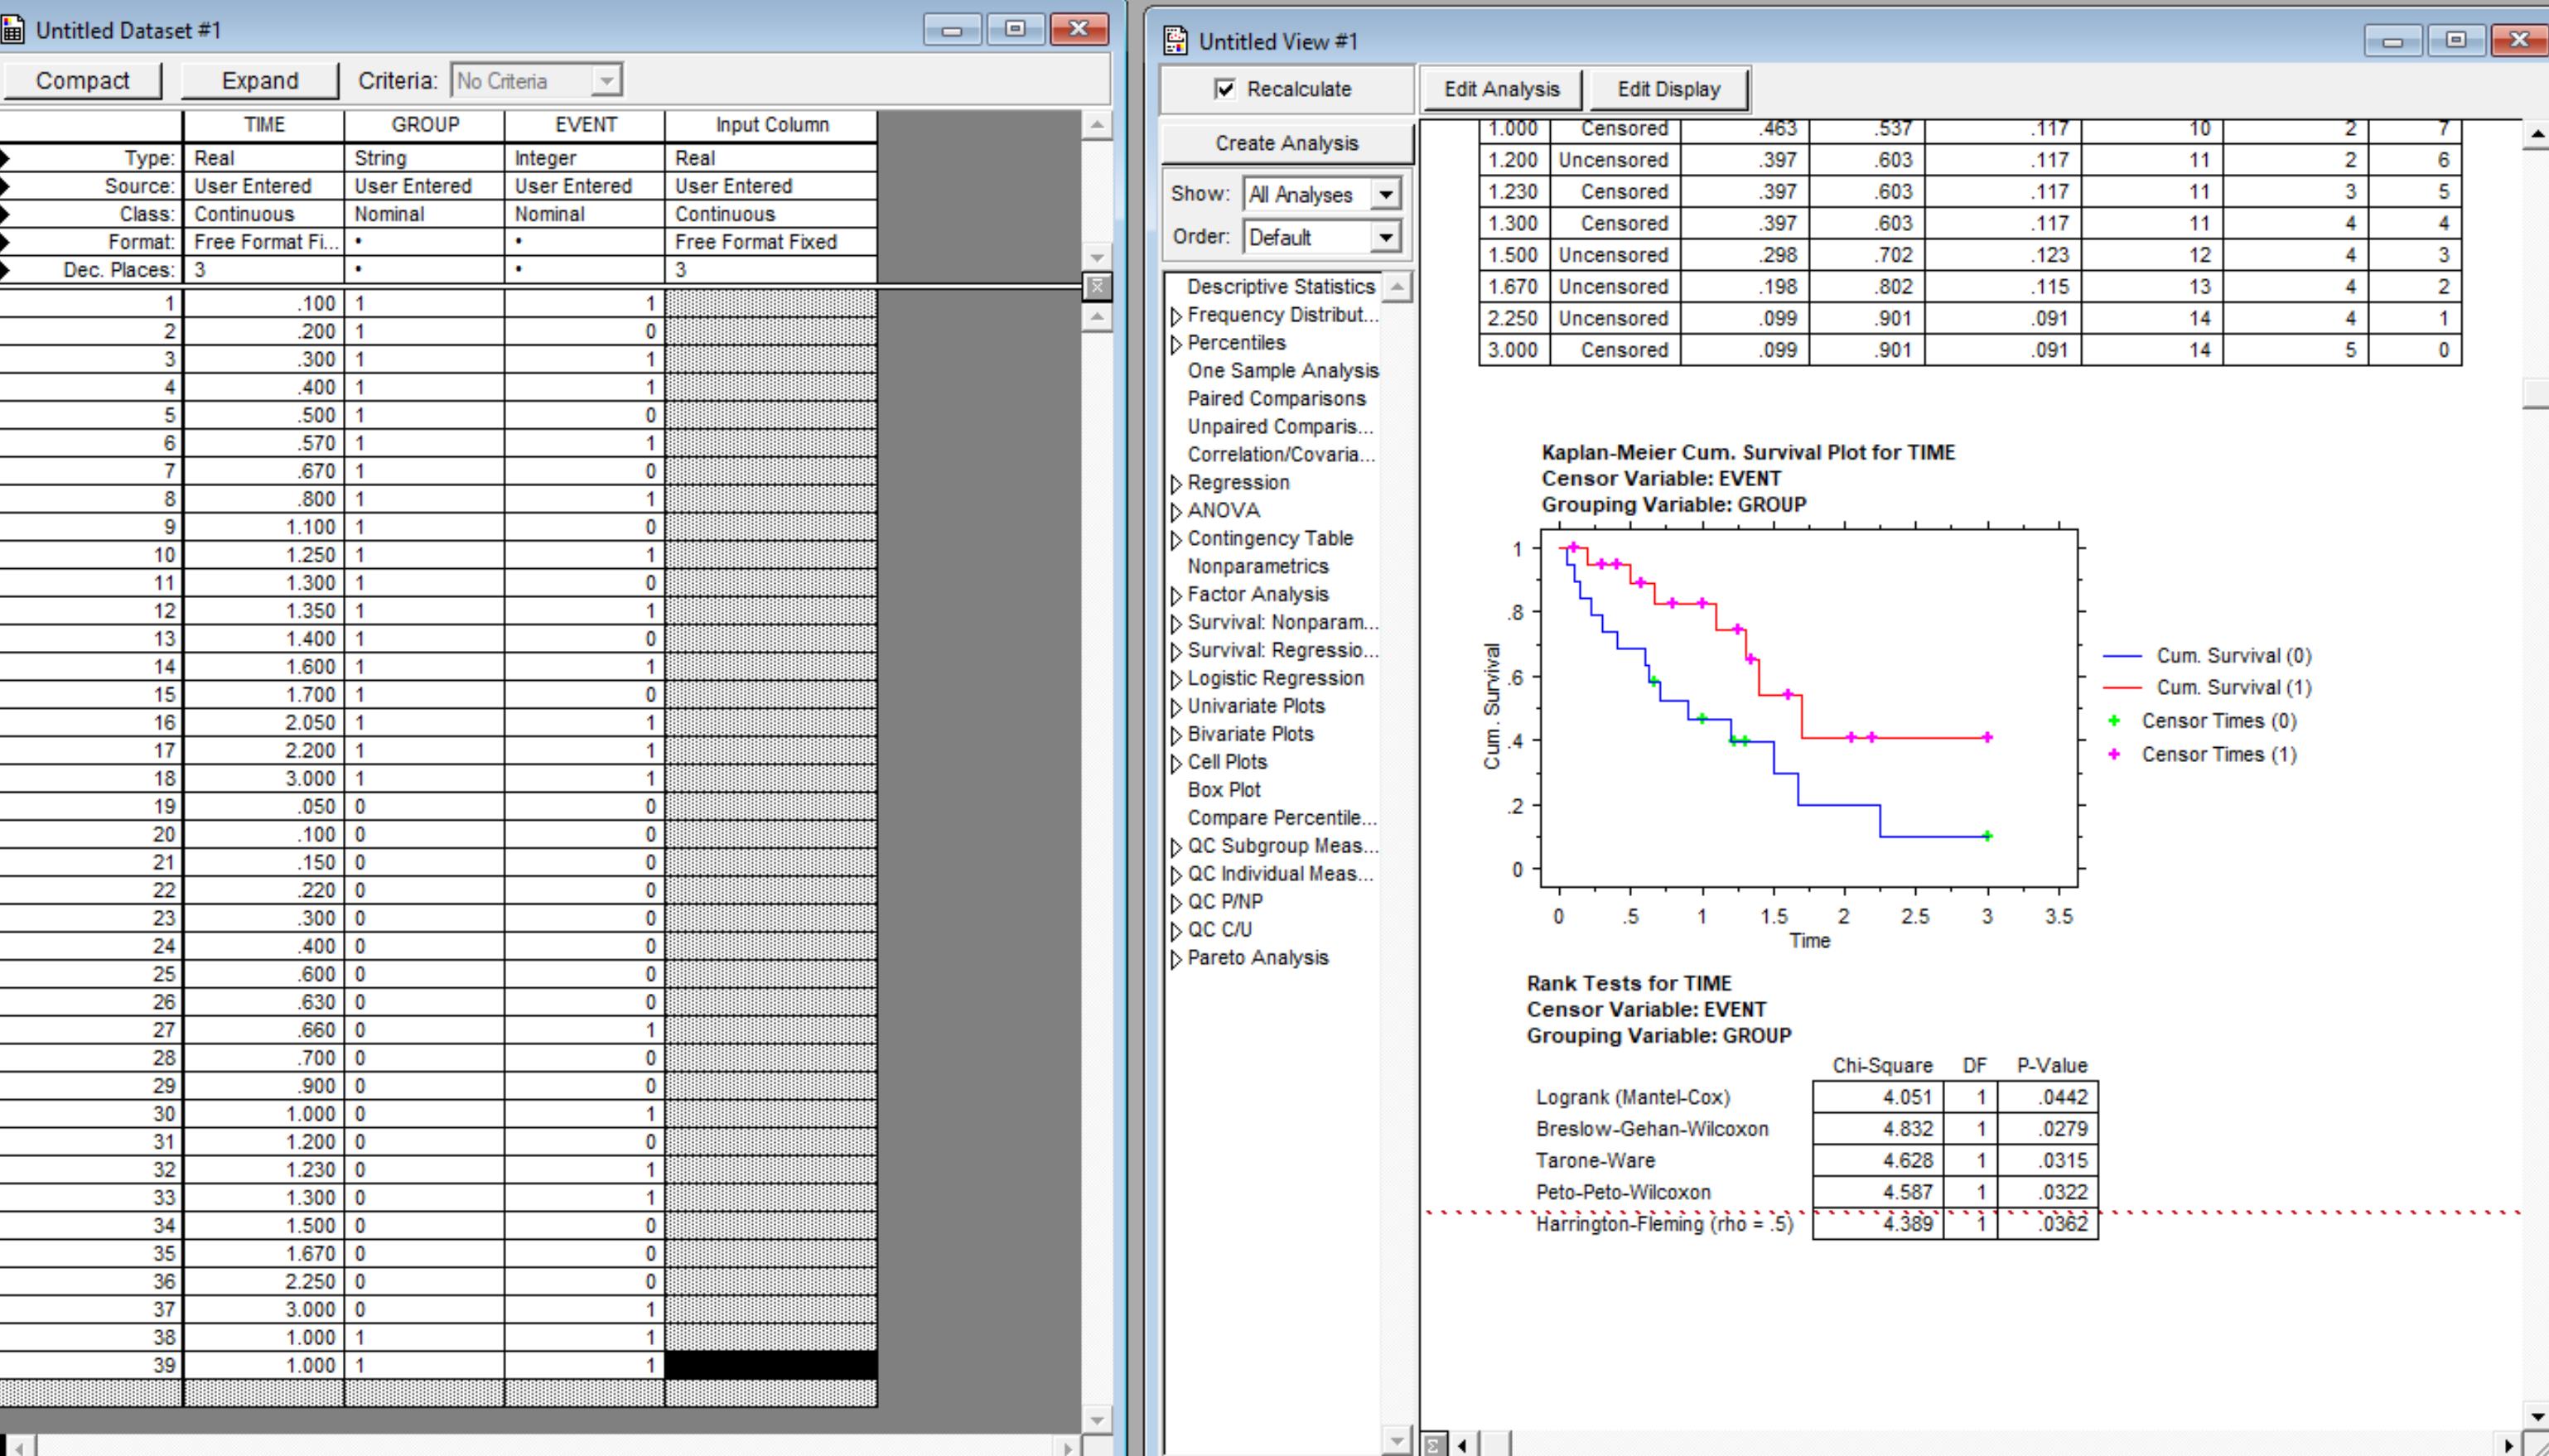
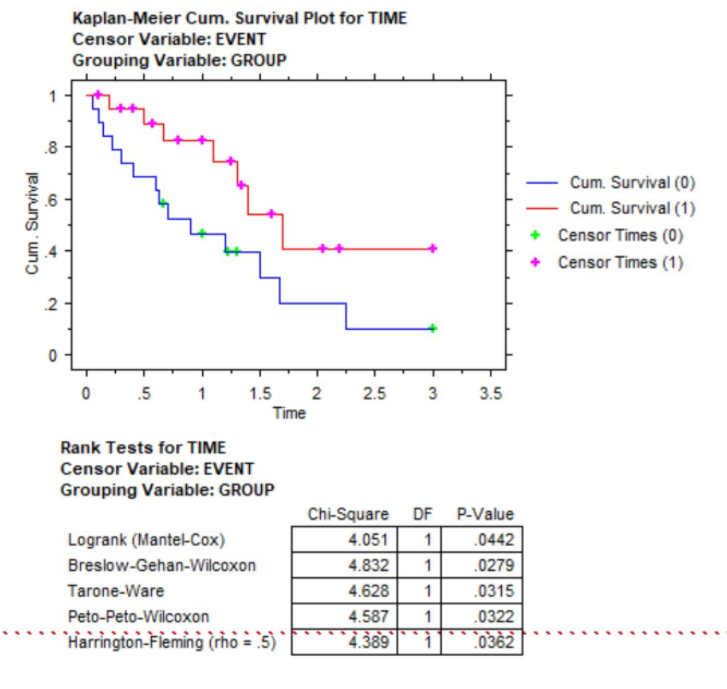
I performed the "experiment" as one possible set of curves among many which could be possible to meet communitydocs a priori that SBRT would be better at 40% 2y OS vs 20% 2y OS. Sure in the real world we would not see (exactly) that, but those are the numbers we have to plug into our calculator so to speak. On the first try, it was insignificant at 37 patients (P about 0.09). Then added a patient (P about 0.06). Then I added another patient. Then it crossed into significance.
Sample size calculation for one sample non-parametric survival (survival proportion) | Kengo Nagashima - Keio University
Sample size calculation for one sample non-parametric survival (survival proportion)
I am not out to convince anyone. Math is math. I am just a walrus what do I know. (And it's not *my* widget!)I guess you know more than all the cooperative groups that do Phase III trials with control of 20% and experimental of 40% that enroll 175-250 patients. To think we could do these studies with only two dozen patients.
Count me completely unconvinced. I will admit that don't know what your widget is doing but "one sample" is concerning.
Separate issue competing risks.I am not out to convince anyone. Math is math. I am just a walrus what do I know. (And it's not *my* widget!)
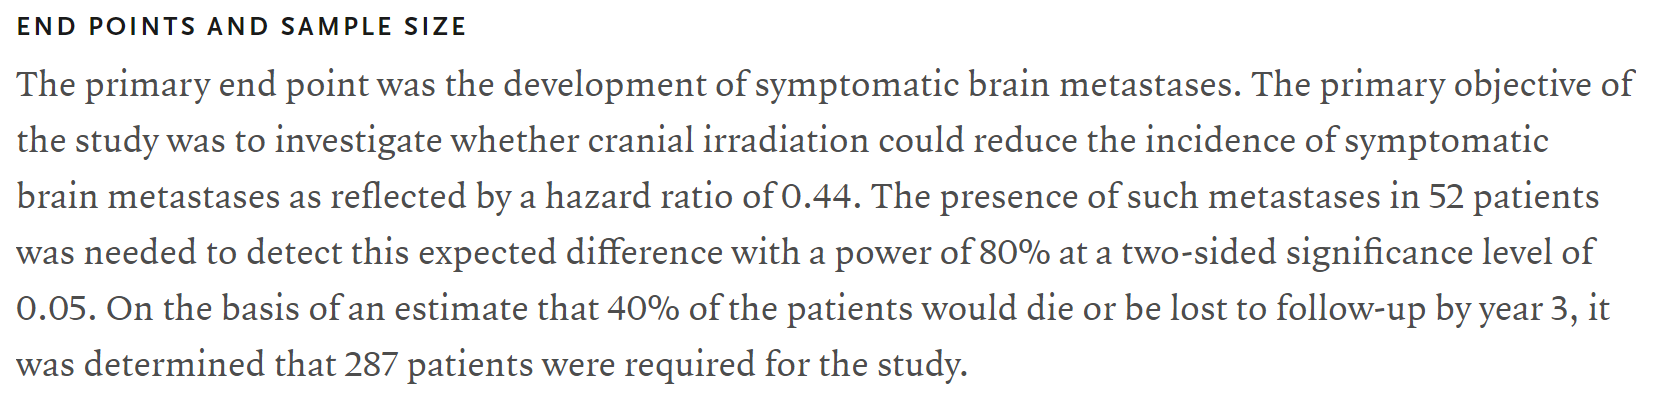
Have we ever seen a trial where they were talking 20% failure rate vs 40% failure rate at 2y and they wanted 160 patients??? You have to read between the lines here a bit, but here is Slotman's ES-SCLC PCI trial. (It's all I can think of at the moment.) They were looking at big differences (brain met occurrence vs not) and calc'd needing just 52 patients. But of course they had to figure in death. Above, we have been "figuring in death" all along.
Well. I have shown simulated data to match communitydoc's hypothetical. And calculated data with references which perfectly match the simulated data/the hypothetical. And trials where biostatisticians looking at large differences estimated needed N's <<< 160.Separate issue competing risks.
I still think your example is p-hacking
The 287 number is key not the 52I am not out to convince anyone. Math is math. I am just a walrus what do I know. (And it's not *my* widget!)
Have we ever seen a trial where they were talking 20% failure rate vs 40% failure rate at 2y and they wanted 160 patients??? You have to read between the lines here a bit, but here is Slotman's ES-SCLC PCI trial. (It's all I can think of at the moment.) They were looking at big differences (brain met occurrence vs not) and calc'd needing just 52 patients. But of course they had to figure in death. Above, we have been "figuring in death" all along (ie death was the event).
Look at the censoring for the SBRT trial in question!! We don't need people running 30-50 person trials! Unless your Patchell I knew you would say that! Brain mets were the event. Death was not. To get enough patients to study the event, they assumed a death rate and "bumped" the number way up. Sans deaths, they would need 52 patients based on the assumed/predicted differences in brain met events PCI vs not, and that was a HR of 0.44. For the curves I showed above which met your a priori of 2y OS of 20 vs 40%, the HR I'm getting for the between curves is 0.38 (95% CI 0.16-0.91). This explains why we are seeing a sample size calc of about 38 or 39 vs 52 when Slotman did his thing.The 287 number is key not the 52
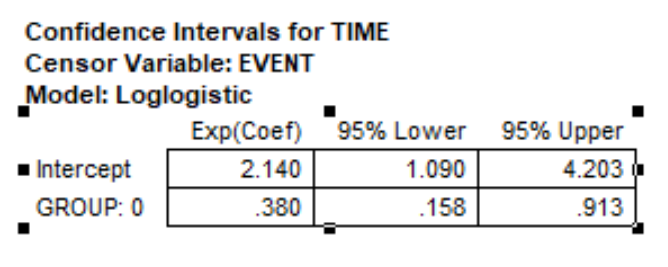

I think that the widget is telling you the lowest possible number of patients needed with the perfect distribution of events. It is, so to speak, the minimum needed to show an effect.I knew you would say that! Brain mets were the event. Death was not. To get enough patients to study the event, they assumed a death rate and "bumped" the number way up. Sans deaths, they would need 52 patients based on the assumed/predicted differences in brain met events PCI vs not, and that was a HR of 0.44. For the curves I showed above which met your a priori of 2y OS of 20 vs 40%, the HR I'm getting for the between curves is 0.38 (95% CI 0.16-0.91). This explains why we are seeing a sample size calc of about 38 or 39 vs 52 when Slotman did his thing.
NB: A sample size calc is always the minimum number to meet the criteria (usually α=0.05 1-β=0.8).I think that the widget is telling you the lowest possible number of patients needed with the perfect distribution of events. It is, so to speak, the minimum needed to show an effect.
I have never seen such a large effect size hypothesized for the experimental arm for a randomized trial before; again, the closest I could come was Slotman's guess at the effect of PCI in ES-SCLC. To reiterate, he guessed a HR=0.44. Communitydoc guessed (although neither he nor I knew it when he did guess what he initially guessed) a HR=0.38. Both of these are really, really large between-group differences if you look at any other prospective trial in comparison.I don't believe that a reputable statistician recommend a sample size this small in a prospective trial; even with the large effect size.
I co-authored 5th and 6th editions (I am old too). That fuzzy* math pre-dated me. I'd write a humorous letter to Luther now were he still alive.Source Chapter 7, page 179 Perez and Brady Second Edition (yeah I am old)
Table 7-4
Patients required to Detect Improvement in Survival over Baseline Survival
Control Arm 20%
Experimental Arm 40%
Alpha=0.05
1-Beta=0.80
n=150
Alpha=0.05
1-Beta=0.90
n=200
????
Humor me more please; serious questionsNB: A sample size calc is always the minimum number to meet the criteria (usually α=0.05 1-β=0.8).
I have never seen such a large effect size hypothesized for the experimental arm for a randomized trial before; again, the closest I could come was Slotman's guess at the effect of PCI in ES-SCLC. To reiterate, he guessed a HR=0.44. Communitydoc guessed (although neither he nor I knew it when he did guess what he initially guessed) a HR=0.38. Both of these are really, really large between-group differences if you look at any other prospective trial in comparison.
I co-authored 5th and 6th editions (I am old too). That fuzzy* math pre-dated me. I'd write a humorous letter to Luther now were he still alive.
*Freedman's table in Brady and Perez doesn't account for tim
The important number is the number of events that inform the hypothesis tested.NB: A sample size calc is always the minimum number to meet the criteria (usually α=0.05 1-β=0.8).
I have never seen such a large effect size hypothesized for the experimental arm for a randomized trial before; again, the closest I could come was Slotman's guess at the effect of PCI in ES-SCLC. To reiterate, he guessed a HR=0.44. Communitydoc guessed (although neither he nor I knew it when he did guess what he initially guessed) a HR=0.38. Both of these are really, really large between-group differences if you look at any other prospective trial in comparison.
I co-authored 5th and 6th editions (I am old too). That fuzzy* math pre-dated me. I'd write a humorous letter to Luther now were he still alive.
*Freedman's table in Brady and Perez doesn't account for time
I think your sample size only works if all participants experience the event by the time of analysis... We never have complete follow-up and this is why K-M is used.
So if we knew that all participants would experience the event then only 52 would be required.
Do you agree?

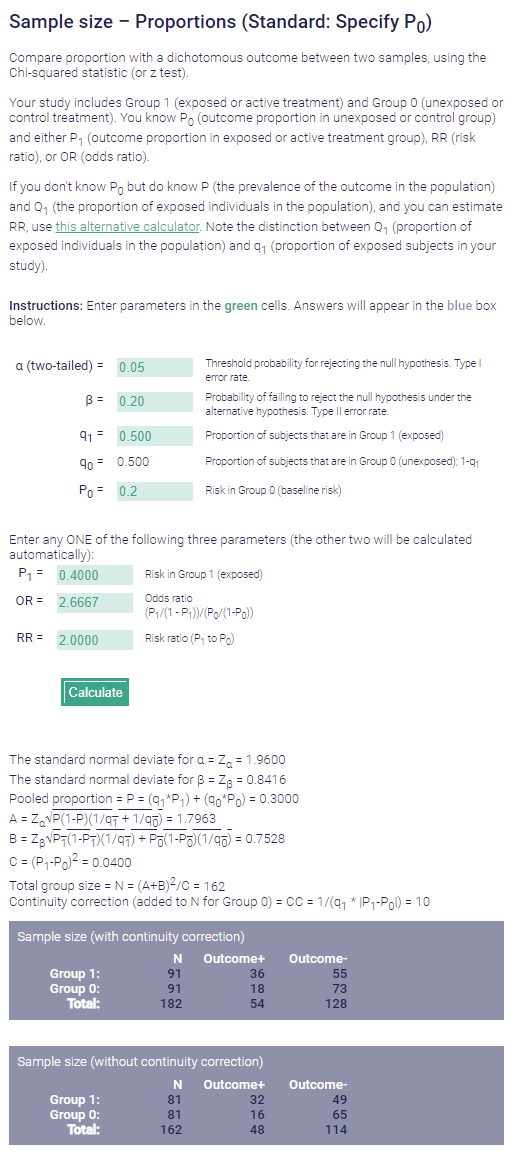
If you do a straight simple 0.2 vs 0.4 survival* then yes of course you get a different sample size needed:I don't think so. I am... inelegant in explaining the KM things. But I have a good sense of the numbers, theory, assumptions. (Btw I agree of course re: "We never have complete follow-up and this is why K-M is used.") If all participants experience an event, then the survival for a group is 0%/the failure rate is 100%. So, no, we don't know all participants experience an event in a sample size calc. "By the time of analysis" is a moot point per the parameters of Communitydoc's a priori:
He is specifying the instantaneous survival function at t=2 years. As I showed above, this 20% vs 40% difference at 2 years with nice, benign, slopey KM curves implies a HR of 0.38 between the groups. And let's say we had lots of retrospective data showing some huge improvement difference for a non-standard treatment that implied HR=0.38. Yeah, I would not say we would need a N>100 trial. Look at another calculator:
OK I get the proportion survival difference. Thanks for teaching meIf you do a straight simple 0.2 vs 0.4 survival* then yes of course you get a different sample size needed:
* I am cheating, it's the wrong word here. "Survival" means something very specific at least pertaining to KM curves.

You are correct, good pick up....Let's go with 34 events. Is this the sample size required? My understanding is that this is the number of events necessary for the power. Sample size would then depend on how many people it would take to get that many events (baseline risk of control). Or is this wrong as well?
I will try to summarize what I take away from this thread.You are correct, good pick up....
Which is why don't pay me to be your biostats guy. But you can pay me to be a harsh critic! From my simulated KM example above in 39 patients I forecasted 21 events. So the probable sample size is going to lie in the 80-max range from that UCSF calculator, but again depending on which calculator and time points and assumptions you choose can be as low as the upper-30s for a 0.8 power.
 jamanetwork.com
I agree that it was flawed and I don’t think it was just related to dose or stats (though I agree both were a bit flawed). Here is my logic. What are the possible responses to IO therapy? Progressive disease, stable disease, PR, or CR. What percentage of patients achieve any response to IO? It’s right in the graph: 75% progression within 10 months. What are the chances that anyone who doesn’t even achieve stable disease is going to get an augmented systemic response to IO therapy? Very tiny. In other words, in unselected patients IO is unlikely to work and RT is unlikely to help. We can argue about powering but any effect we see is arguably small and again I think that just reflects the fact we were probably asking too much of radiation with that design. If you consider the biology, this makes sense. So many things have to go right to stimulate systemic immunity. In an individual tumor radiation might be able to help with a couple but It can’t do much more than that.Actually the trial design was flawed. This only works if you use Radscopal doses on a 2nd met, 1 - 2 Gy, combined with abscopal-range doses in the primary met. Obviously, this stuff is bulletproof and works every time, and patients love hearing these cool sounding names.
Low-dose radiation treatment enhances systemic antitumor immune responses by overcoming the inhibitory stroma | Journal for ImmunoTherapy of Cancer "Ultimately, we propose that our radiation strategy with H-XRT and L-XRT (which we call ‘RadScopal’ technique) in combination with checkpoint inhibitors, modulates the tumor microenvironment (TME) of both primary and secondary tumors to maximize systemic antitumor effects in solid tumors."
Totally agree. We are shooting blindly with most of the current trial designs. If the best we have is 'we know it works sometimes but we have no predictive capacity' then perhaps we need dedicated, high-enrolling trials (with multiple current generation genomic & immunologic & imaging metrics) to get closer to an answer. Tons of work to be done, and inarguably foolish to declare IO+SBRT a failed idea by Ost.Basic science experiments largely support this hypothesis. What cell lines consistently give good abscopal responses? B16F10 (a highly mutagenic murine melanoma model) and MC38 (and MLH1 deficient MSI mutated colorectal model) to name a few. Both also have about a 30% response rate (+\- a bit) to IO alone. What happens if you add SBRT dosing to an IO resistant cell line like CT26 (an MSS colorectal line)? Nothing.

 pubmed.ncbi.nlm.nih.gov