Advertisement - Members don't see this ad
Ok, that thread about v/t graph got me all confused.
I don't need the explanations (I will hopefully be able to explain it to myself), I just need the facts.
For a displacement vs time graph.
Slope = ?
Area under the curve = ?
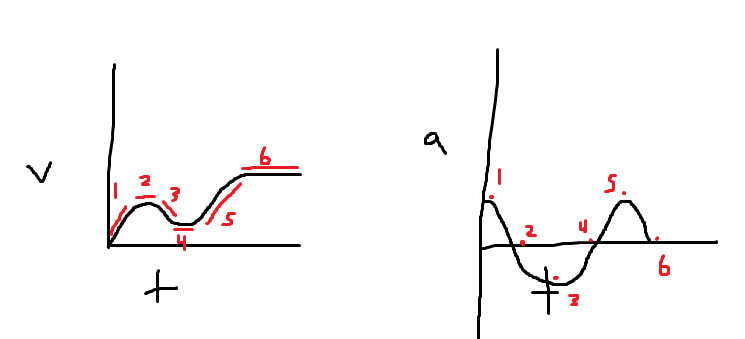
For a velocity vs time graph.
Slope = ?
Area under the curve = ?
For an acceleration vs time graph
Slope = ?
Area under the curve = ?
I don't need the explanations (I will hopefully be able to explain it to myself), I just need the facts.
For a displacement vs time graph.
Slope = ?
Area under the curve = ?
For a velocity vs time graph.
Slope = ?
Area under the curve = ?
For an acceleration vs time graph
Slope = ?
Area under the curve = ?