- Joined
- Mar 22, 2016
- Messages
- 254
- Reaction score
- 975
Hello!
I know that this question has been asked in some capacity a few times on this forum, but I have a slight change to it.
The question from BR Section IV (Periodic Motion) is as follows:
Which graph BEST represents the relationship between the frequency and wavelength of waves emitted from a stereo speaker, if the wave speed is fixed?
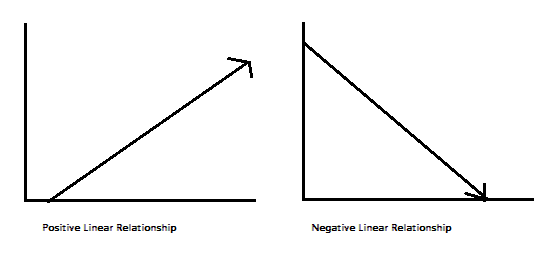
I've been able to narrow it down to the two inversely proportional graphs, but I'm having some trouble figuring out asymptotic vs. linear. I eventually understand that it is asymptotic because of f = v(λ^-1), but this leaves me wondering what relationship would ever lead to a negatively sloped, linear graph? The intercepts with 0 seem pretty unlikely to accurately describe any real-life relationships, right? Could someone provide me with an example where a graph that is negative, linear, and intercepting the x- and y-axes? Also, what would the accompanying formula look like for this relationship?
Thanks!

