MCAT Score Conversion Chart

This forum made possible through the generous support of SDN members, donors, and sponsors. Thank you.

Heisenberg 41

Full Member
7+ Year Member
Joined
Nov 28, 2013
Messages
161
Reaction score
187
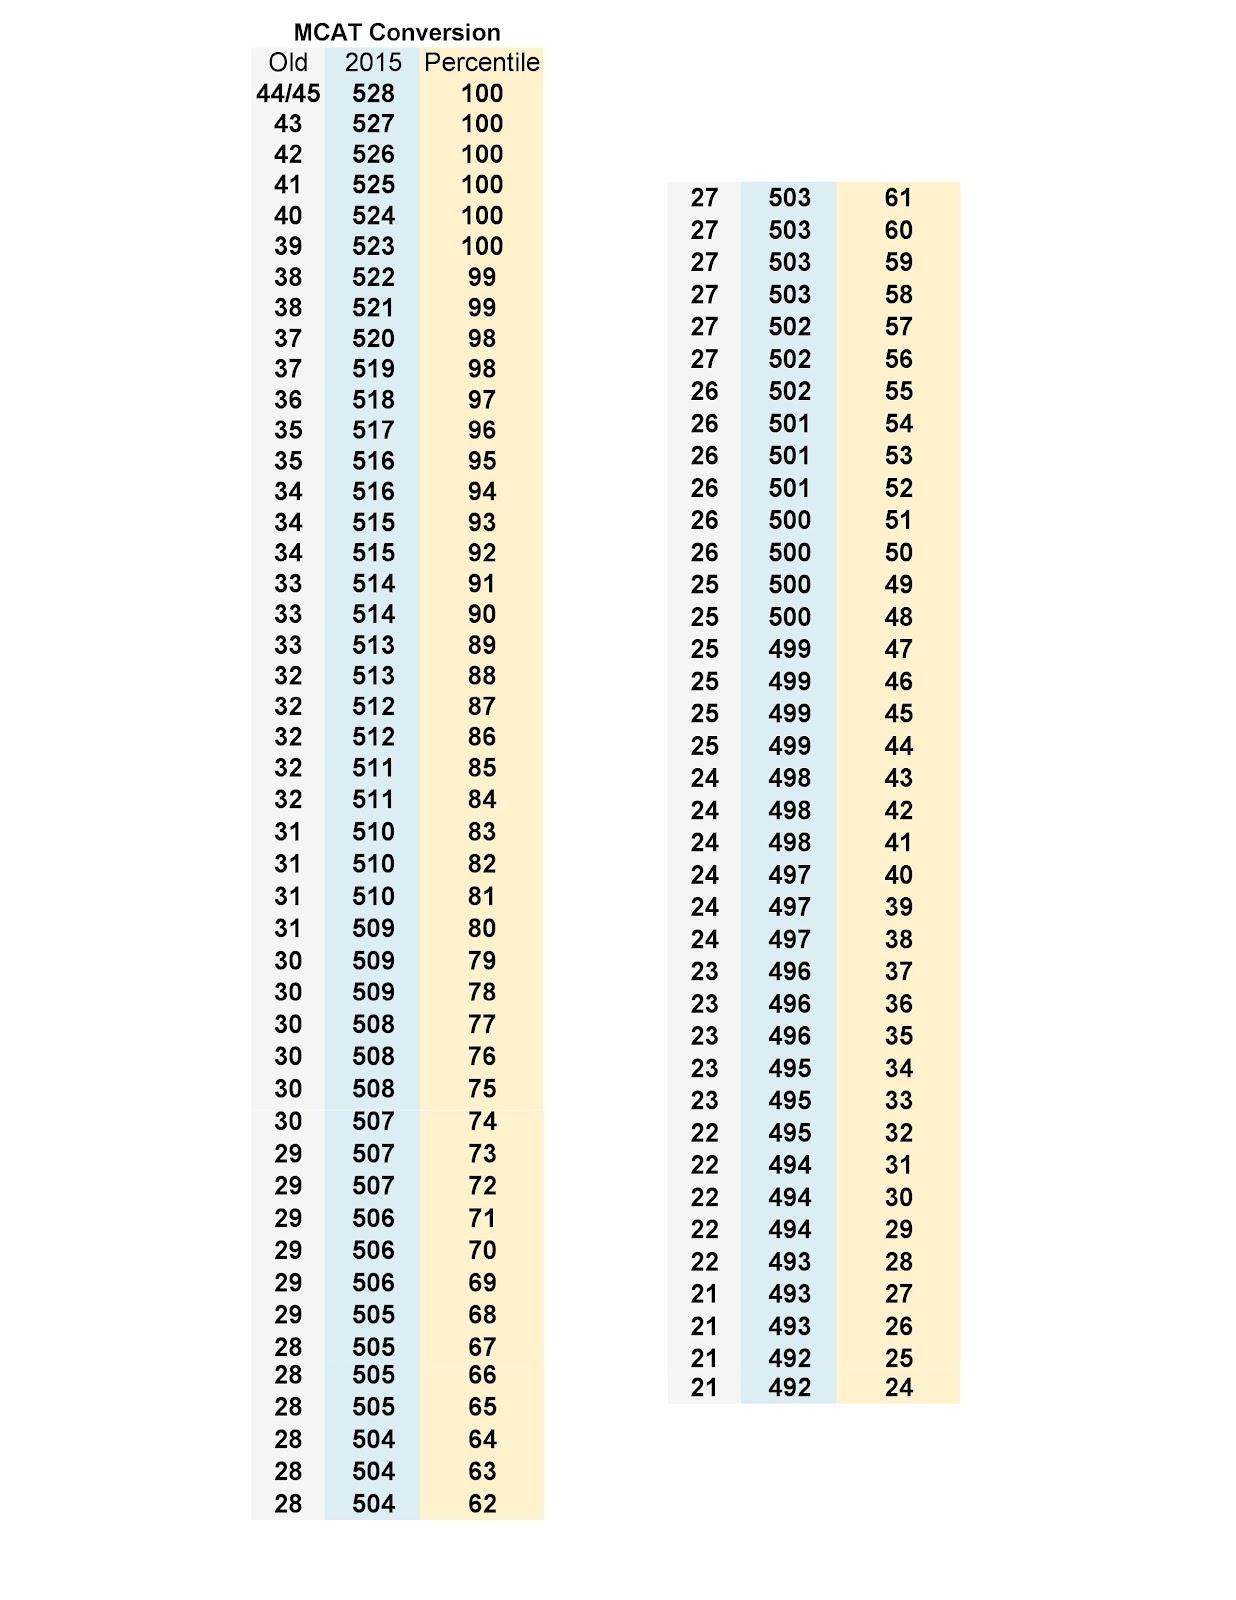
I put together a score conversion chart using the AAMC percentile rankings. Hopefully this will make it easier for everyone!
Source: 2015 MCAT Percentiles Old MCAT Percentiles

Z1bteEgQoesmbHvj7yCmy6x90noNGMgl7UEIVSQcgopaCrHsPTbCeZ8wowqdch-jSPkaotnbKH8Btd45ZQ3KWVqo9GA3exfXgEKBKdihP_Tw-orA7OFV-DmJO1kxLHlWDlvR9ZM

Members don't see this ad.
 

Attachments

  • MCAT Score Conversion.jpg
    MCAT Score Conversion.jpg
    87.5 KB · Views: 646
  • Like
Reactions: 1 user
Thanks, Walter. Please give my best to Skyler and Walt, Jr.

Will be interesting to see if the experts downgrade the low end of 34, 33, 32, 31, 30, 29, etc
 
Thanks, Walter. Please give my best to Skyler and Walt, Jr.

Will be interesting to see if the experts downgrade the low end of 34, 33, 32, 31, 30, 29, etc
Ours looks more like @efle's
 
Last edited by a moderator:
I think this is pretty accurate except for the first line: 44/45 = 528. Since it's easier to get a perfect score on any given section of the new test than it was for the old test, there really is no current equivalent to a 45 (perhaps not even to a 44, given that almost nobody got a 15 on the old PS and VR, effectively capping the test at 43). So maybe "45 = n/a" and "43/44=528."
 
  • Like
Reactions: 1 users
Members don't see this ad :)
I think this is pretty accurate except for the first line: 44/45 = 528. Since it's easier to get a perfect score on any given section of the new test than it was for the old test, there really is no current equivalent to a 45 (perhaps not even to a 44, given that almost nobody got a 15 on the old PS and VR, effectively capping the test at 43). So maybe "45 = n/a" and "43/44=528."
I had a hard time with 44/45 since they all are listed as 100th percentile, and I just wanted to match up everything exactly with the AAMC official percentiles. Everything else should be accurate, since I didn't do any speculating.
 
  • Like
Reactions: 1 user
Like EverStriving said, so many people are getting perfect scores now on BOTH verbal and p/c. It used to be either one or the other or neither, IMO, effectively capping the top score at 44. I agree that 45 should be n/a
 
^^^

I have to agree that Efle's seems more accurate and clear than this one.

Here is Efle's.

http://forums.studentdoctor.net/thr...centile-comparison-conversion-tables.1143689/

It all depends on how you read it. Even in Efle's model 507 and 508 are clearly ABOVE the 29 marker. I can't think of any chart ever where you are supposed to interpret scores that land ABOVE a marker as equal to that marker. In other words, there are no differences in the charts other than how one designates scores that fall above the old hard numbers and below the next hard number.

Now, psychologically speaking, if I had a "hard" 29 on the old test I would want what counts as 29 on the new test to go as high as possible, and I would be invested in adcoms viewing my old 29 as a 508. If I have a 508, I am of course invested in that 508 not being reduced to a 29.
 
Last edited:
It all depends on how you read it. Even in Efle's model 507 and 508 are clearly ABOVE the 29 marker. I can't think of any chart ever where you are supposed to interpret scores that land ABOVE a marker as equal to that marker. In other words, there are no differences in the charts other than how one designates scores that fall above the old hard numbers and below the next hard number.

Now, psychologically speaking, if I had a "hard" 29 on the old test I would want what counts as 20 on the new test to go as high as possible, and I would be invested in adcoms viewing my old 29 as a 508. If I have a 508, I am of course invested in that 508 not being reduced to a 29.

This. Both charts are inherently correct. One is not better than the other...
 
If you understand the concept of bins and ceilings, then you would know that both charts are depicting the same exact thing lol
 
  • Like
Reactions: 1 user
It all depends on how you read it. Even in Efle's model 507 and 508 are clearly ABOVE the 29 marker. I can't think of any chart ever where you are supposed to interpret scores that land ABOVE a marker as equal to that marker. In other words, there are no differences in the charts other than how one designates scores that fall above the old hard numbers and below the next hard number.

Now, psychologically speaking, if I had a "hard" 29 on the old test I would want what counts as 29 on the new test to go as high as possible, and I would be invested in adcoms viewing my old 29 as a 508. If I have a 508, I am of course invested in that 508 not being reduced to a 29.

Where did I say that a 507 and 508 are not above the 29 marker?

I think you are looking too much into playing my own MCAT scores into this context, which is kind of getting annoying now because I've already said my views have nothing to do with my own score.

I literally said nothing about any particular score range or anything.

Almost every single score on Efle's chart has its own percentile. I believe it makes it much more clear where your score lies percentile wise in Efle's chart.

That is all I'm saying.

I am not saying Heisenberg's Chart is bad.

However, Ggyngyn is an adcom who came up with a chart closer to Efles as he said above. I'll take his chart over anyone else's.

So you are acknowledging that a 507 and 508 are above a 29 but you still side with calling them 29s?

Gyngyn didn't say his (her?) take was written in stone. In fact, gyngyn has said we are in flux and in an adjustment period. I haven't gotten any indication that gyngyn has closed the door to thinking about how best to evaluate the scores. In any event, gyngyn is one adcom. Perhaps 90% of adcoms will end up seeing a 508 as a 29. Perhaps that will be very much the minority assessment. No way to know that, especially this early in the game with the new MCAT.

I'm not even sure you read my posts in the other thread correctly. "Pretty much the same" is not equal to "The exact Same". I PERSONALLY do not believe that there is much differece between a 77 percent on the test and a 73 percent or a 69 percent on the test and a 73 percent. However obviously I"m not saying that a 73 percent is the exact same as a 74 or 77 percent. This is why I said its up to the person reviewing your application to determine if they care about differences of that level.
 
Last edited:
If you understand the concept of bins and ceilings, then you would know that both charts are depicting the same exact thing lol
I didn't realize @efle already made a conversion chart! But you're right, they're exactly the same (minus the 39+ unknown territory). Due to some overlap in the AAMC percentiles (esp. in the 29-32 range), there's no perfect conversion scale.
 
Top