After looking at the post @Lucca made in 2016, I decided to make an updated one with 2018 data. Partly because I wanted to know how the program I chose was doing, but mostly because I didn't want to start looking for housing.
I got the data the same way: use the NIH RePORTER system to find all active F30's (under Activity Code, search for "All Other Fs"), downloaded that, and then went to the AAMC T36 B-11 to get the data on program size (converted to a spreadsheet with Acrobat).
Then, I manually matched F30s to institutions, so I wouldn't lose data due to affiliations (i.e. MIT F30s should be matched to Harvard). By looking up individual awardees, I could make links I didn't know about (linking an Indiana student to National Jewish Health, for example), and it let me remove a few of the DVM/PhD and DDS/PhD awards. However, I did not try to go through everything.
So as of 5/6/2018, programs with at least 1 active F30:
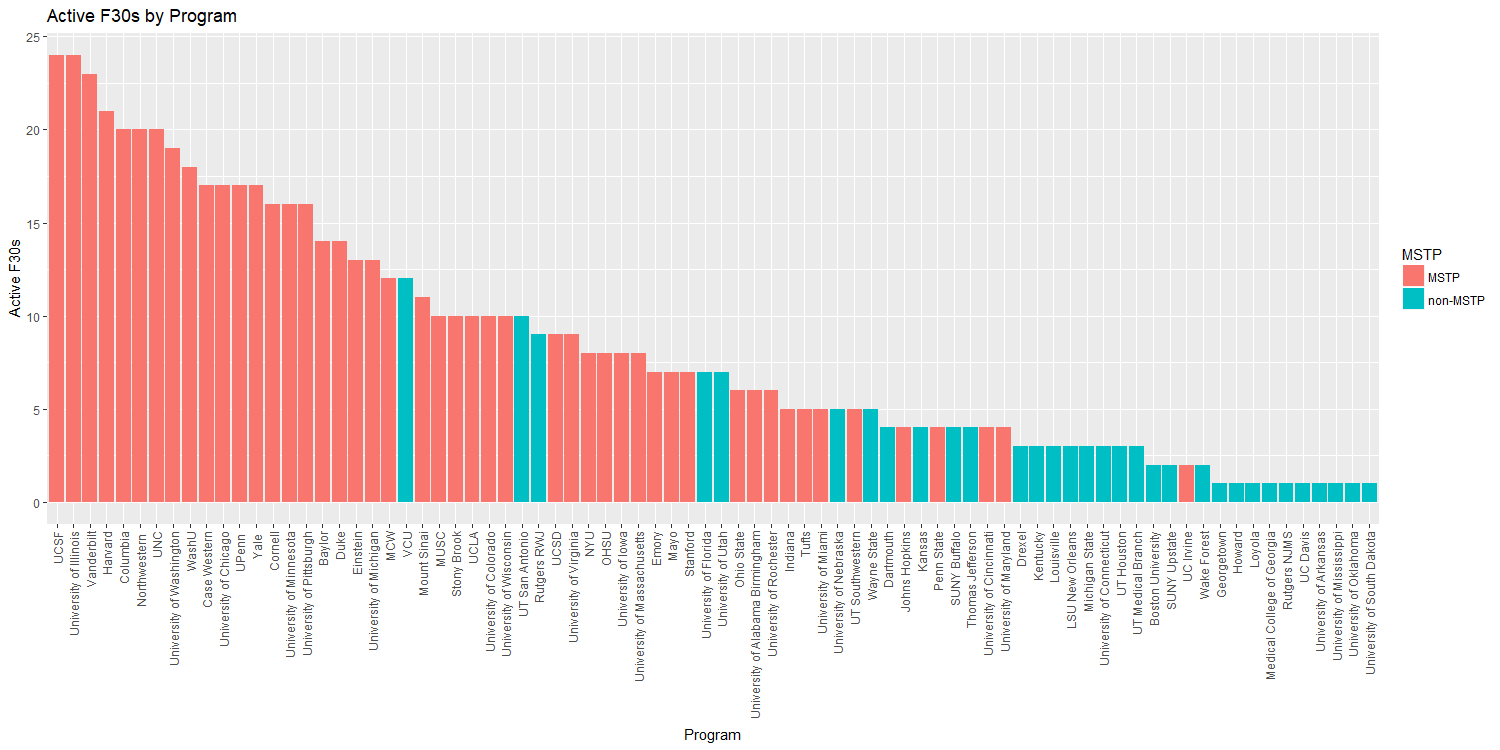
Minimum - 1
1st Quartile - 3
Median - 7
Mean - 8.375
3rd Quartile - 12.25
Max - 24
If we look at the percentage of the program with active F30s, things are complicated by an outlier. Howard has only 1 MD/PhD student, who happens to have an F30.
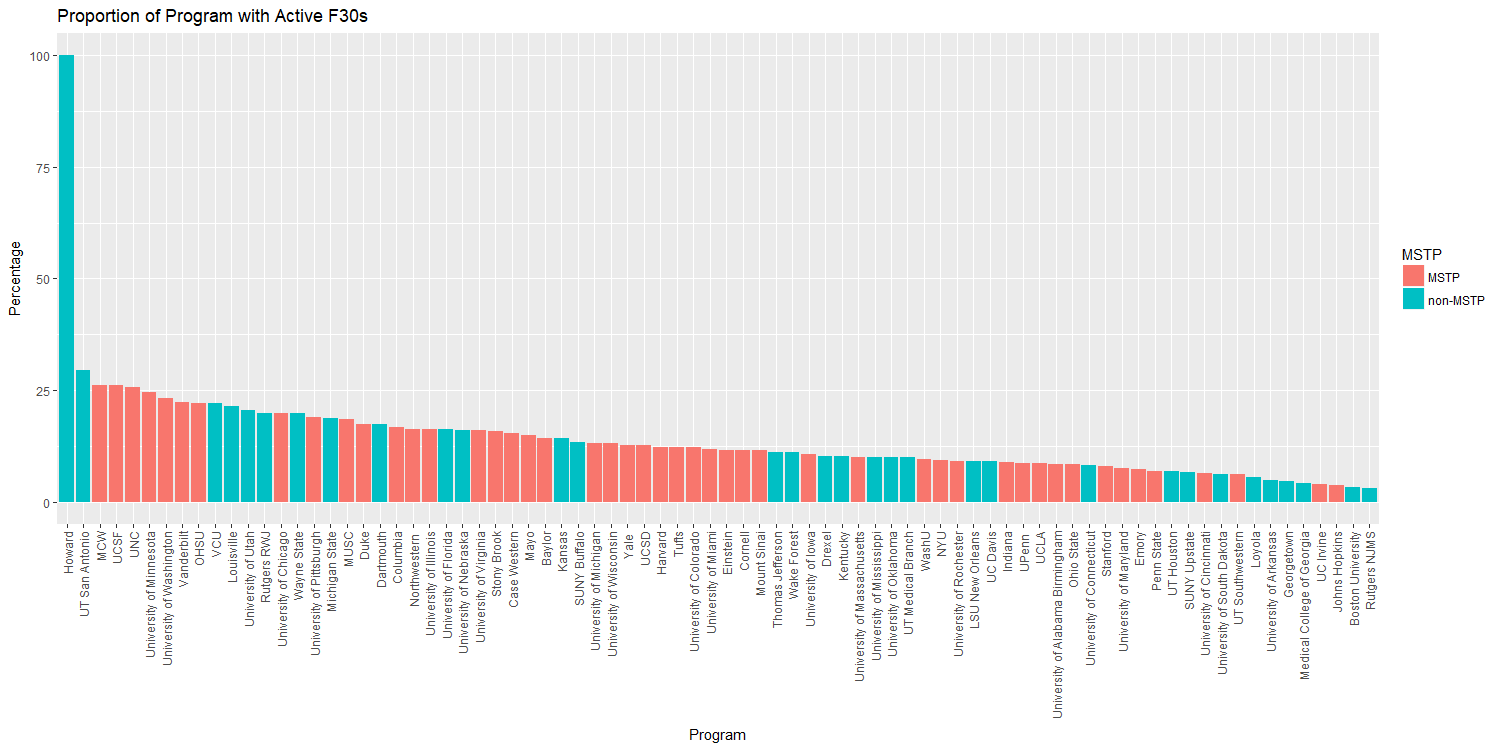
Removing that outlier, we get a better picture:
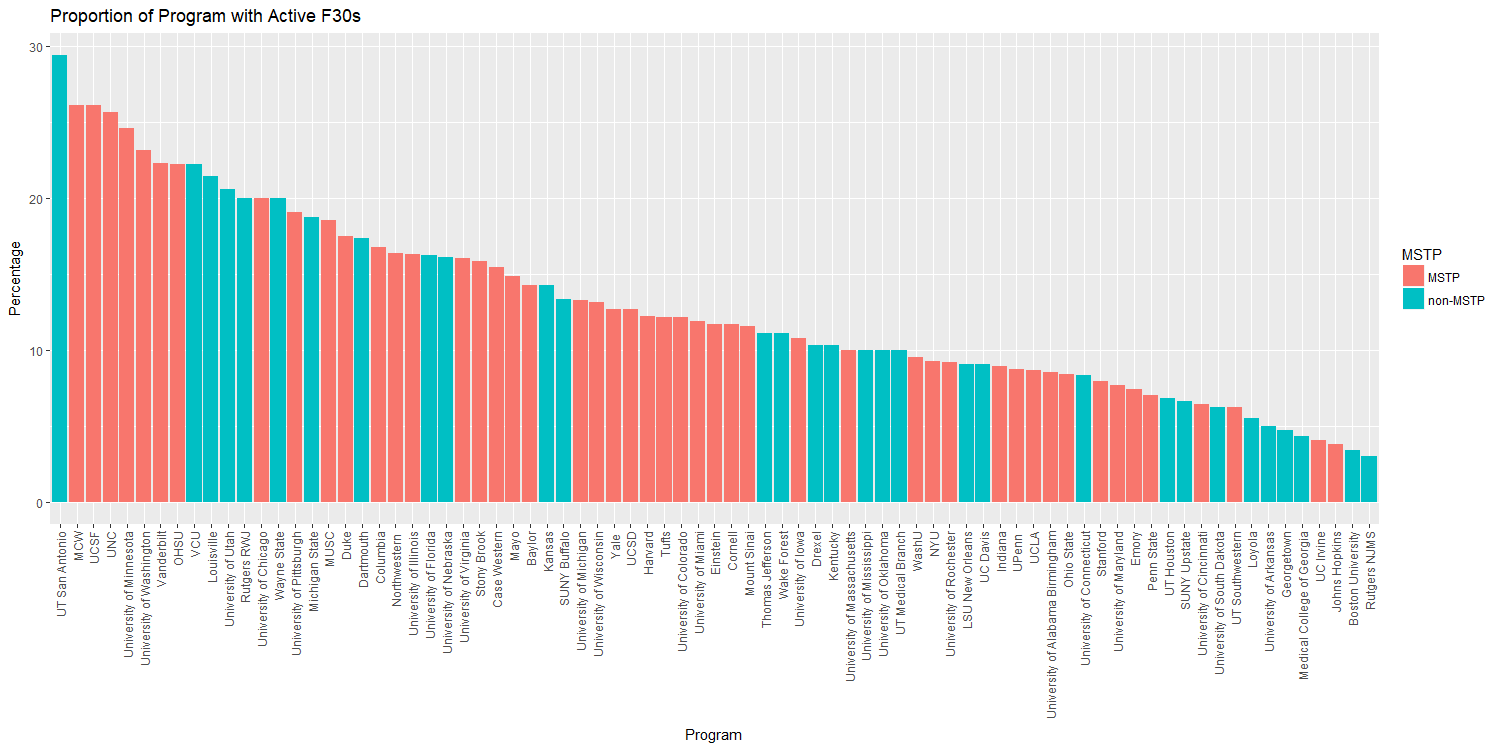
Minimum - 3%
1st Quartile - 8.6%
Median - 11.7%
Mean - 13.0 %
3rd Quartile - 16.6%
Maximum - 29.4 %
Just as a reminder, this only includes F30 data, nothing with F31 or other fellowships. And to echo something from the previous post, we really should look at the numbers for students past the F30 application stage, but it'd take way too long to generate that data, so programs who have been expanding are probably penalized in the percentage analysis.
I'll leave it to others to make/draw any conclusions. The data table I manually put together is also attached, if anyone wants to do more work with it.
I got the data the same way: use the NIH RePORTER system to find all active F30's (under Activity Code, search for "All Other Fs"), downloaded that, and then went to the AAMC T36 B-11 to get the data on program size (converted to a spreadsheet with Acrobat).
Then, I manually matched F30s to institutions, so I wouldn't lose data due to affiliations (i.e. MIT F30s should be matched to Harvard). By looking up individual awardees, I could make links I didn't know about (linking an Indiana student to National Jewish Health, for example), and it let me remove a few of the DVM/PhD and DDS/PhD awards. However, I did not try to go through everything.
So as of 5/6/2018, programs with at least 1 active F30:
Minimum - 1
1st Quartile - 3
Median - 7
Mean - 8.375
3rd Quartile - 12.25
Max - 24
If we look at the percentage of the program with active F30s, things are complicated by an outlier. Howard has only 1 MD/PhD student, who happens to have an F30.
Removing that outlier, we get a better picture:
Minimum - 3%
1st Quartile - 8.6%
Median - 11.7%
Mean - 13.0 %
3rd Quartile - 16.6%
Maximum - 29.4 %
Just as a reminder, this only includes F30 data, nothing with F31 or other fellowships. And to echo something from the previous post, we really should look at the numbers for students past the F30 application stage, but it'd take way too long to generate that data, so programs who have been expanding are probably penalized in the percentage analysis.
I'll leave it to others to make/draw any conclusions. The data table I manually put together is also attached, if anyone wants to do more work with it.