- Joined
- Oct 22, 2013
- Messages
- 8,599
- Reaction score
- 19,864
- Points
- 7,351
- Location
- City of the Future
- MD/PhD Student
sup nerds, read on for some potentially spicy data related to step 1, med school prestige, top IM residency applicants, etc (ur too cool to care about those things but lets face it you're going to post about it anyway so might as well have some graphs to point to).
so every year, residency applicants on the internet will use spreadsheets to anonymously share information about interview invitations, experiences etc. Well, these spreadsheets also happen to have a wealth of information on the applicants themselves but the information has never, to my knowledge, been presented in a particularly helpful way. But Lucca, you might say, dont we have the NRMP Charting the Outcomes data, the best possible source of residency related information available to anyone???? Yes! That's completely right. But this is SDN where we also have endless arguments about things the AAMC (and probably no one else) doesnt care about, like how much the prestige of your med school matters. After doing some data cleaning I made up some graphs to try to extract some basic information from this snapshot of 171 anonymous IM applicants.
caveats and disclaimers:
-yes, this data is anonymous and comes from the internet so obviously grain of salt and all that
-this data (n=171) is a small fraction of the ~11,000 total US IM applicants so it's a snapshot. Think of it like shotgun sequencing a cup of water from a lake to get an idea of whats going on in the lake, but certainly not a thorough census of all life in the lake ecosystem.
-data cleaning: ppl often had funky answers to the school ranking question like Mid-Low tier (?????) so I've lumped all into just 3 buckets: Low, Mid, Top. DO and IMG were automatically sorted to the "Low" category. "Top" was reserved for people claiming Top tier or T20. Everything else was sorted into "Mid". N/A from the original spreadsheet data were removed for the sake of simplicity.
Now that the boring part is over let's look at some graphs.
here's the overall step 1 distributions by school tier:
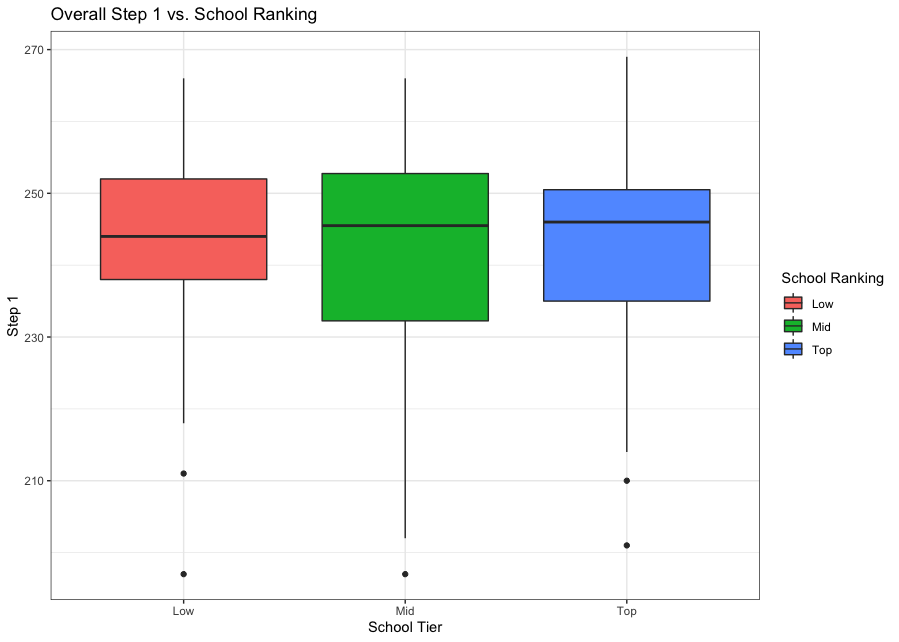
obviously the folks on the IM spreadsheet tend to have pretty high Step 1s with the median floating around 240! Definitely not representative of the overall IM applicant population, but something good to keep in mind. There is also no meaningful difference from any of these distributions as far as Step 1 is concerned.
First, lets look at II to App Yield vs Step 1. Points are individual applicants. Density contours added to aid in visualization. App yield is defined as # of IIs / # of apps sent out.
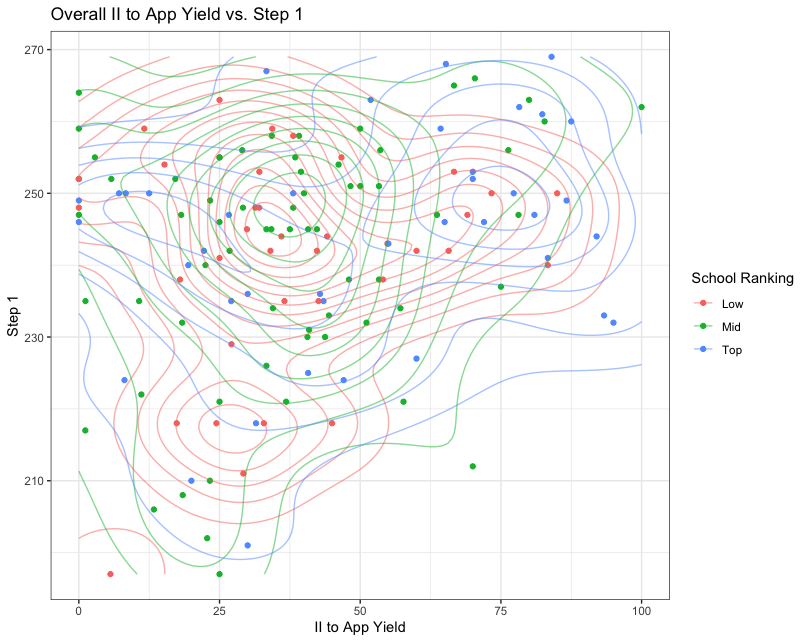
These density maps are almost completely overlapping, with a clear trend for higher yields with increasing step 1 score. This suggests that looking at all potential IM programs in aggregate, Step 1 is a better predictor of overall App Yield compared to School Ranking. Matches up with the received wisdom passed down on Reddit/SDN. Neat.
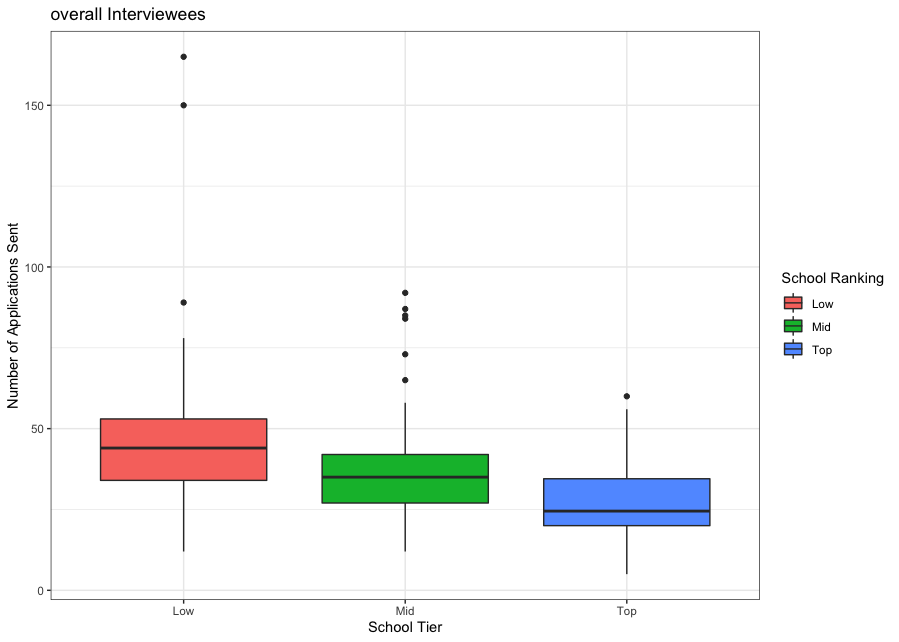
That said, it looks like applicants from higher ranked medical schools tend to be more likely to send fewer applications (indeed, up to less than half as many) than those from lower ranked medical schools. The number of IMGs in this dataset is small enough that I don't think IMGs are skewing the low tier distribution.
Hmmm...but what happens when he zoom in on just the applicants who received an II to one of the Top 8 IM residencies as defined by the Top 100 rankings on the spreadsheet itself? Let's see what the Step 1 distributions look like for those programs as represented by applicants on the spreadsheet who reported receiving an invitation to one or more such places.
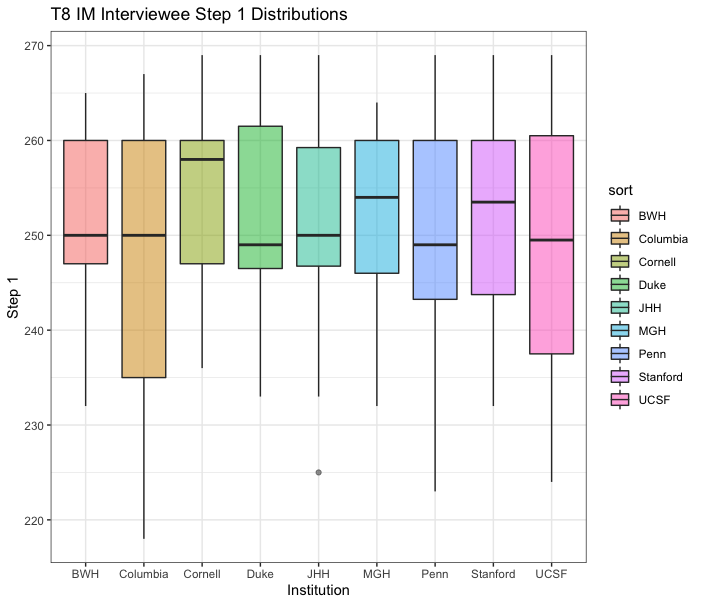
BWH = Brigham and Women's, MGH = Mass General, JHH = Hopkins. Only main-sites were included in this analysis, so places like UCSF-Fresno or Hopkins-Bayview were not counted with JHH or UCSF.
The Step 1 distributions for applicants reporting IIs at the T8 IM residencies are remarkably similar! Medians floating near 250 with short tails on the 25th percentile end and longer tails on the 75th percentile end, with the notable exceptions of Columbia and UCSF which appear to be more symmetrically distributed.
What does the school tier representation look like now that we've zoomed in on these so-called "top" programs?
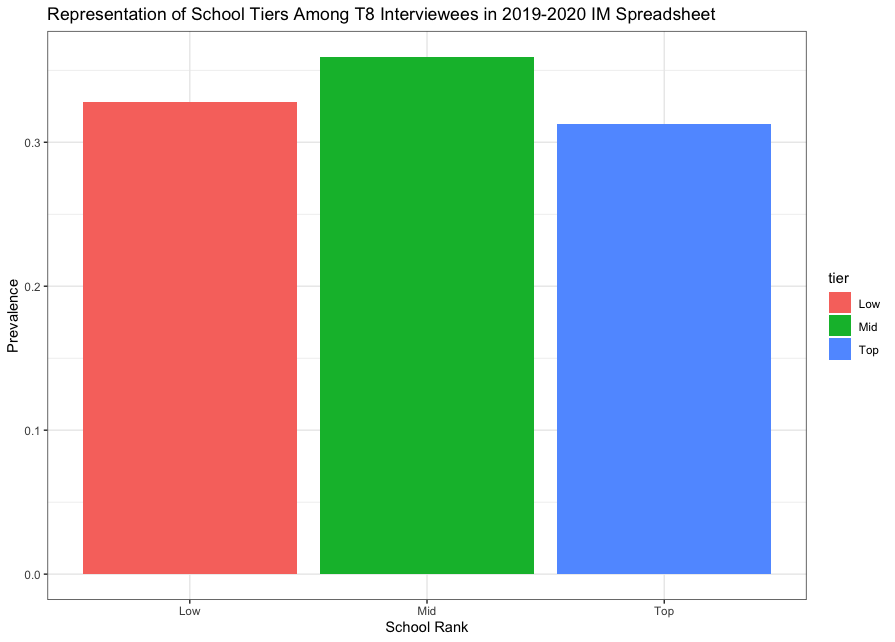
Schools from all tiers appear to be pretty equally distributed across all T8 IM interviewees! We can more directly compare the difference in prevalence from the overall pool like this:
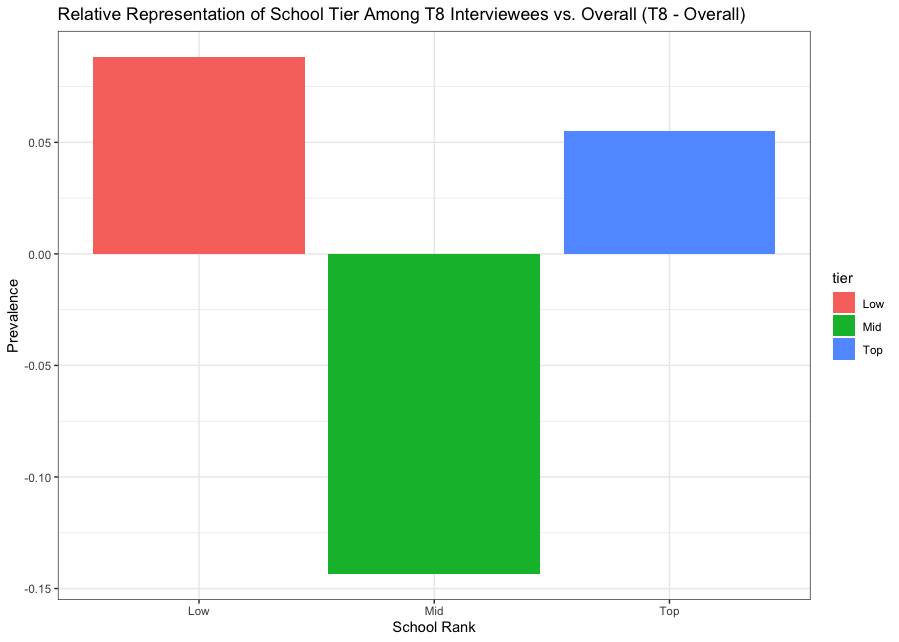
In other words, low and top tier schools are slightly overrepresented in the t8 Interviewee dataset compared to the overall IM spreadsheet applicant pool dataset; mid-tiers slightly underrepresented.
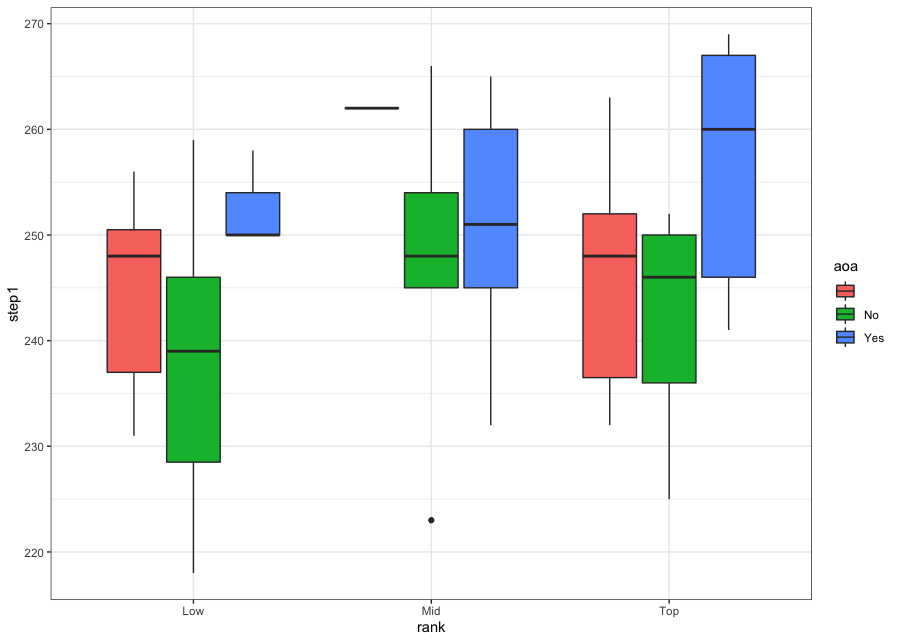
Have the step 1 distributions changed for applicants receiving IIs to T8 IM programs ?
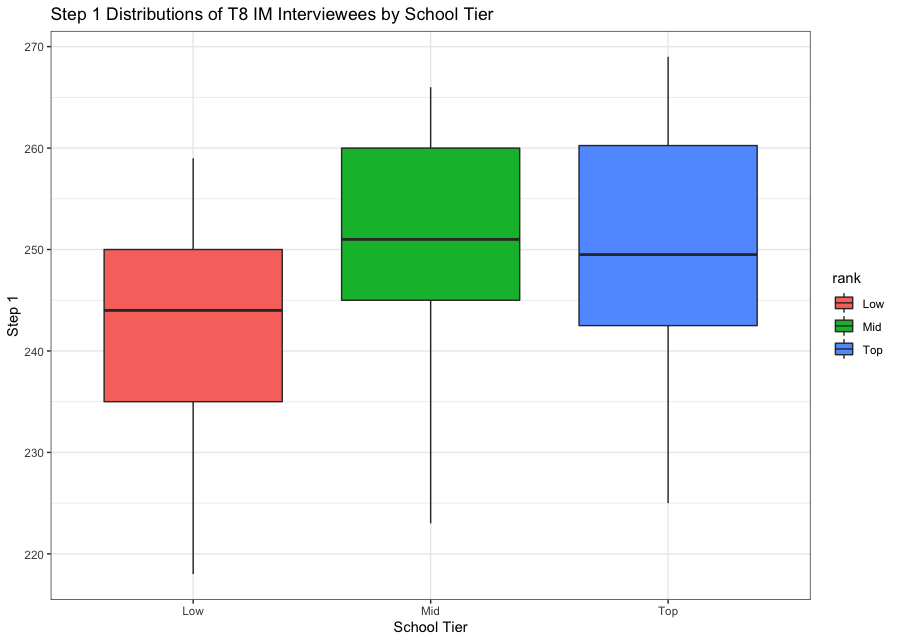
Unsurprisingly, the distributions have jumped up on the Step 1 scale compared to the overall pool. Somewhat surprisingly, the distribution from the "Low" tier population his a bit lower than those in the mid and top tier bracket. This might challenge the oft-repeated wisdom that applicants from "lower tier" medical schools will have to score higher on Step 1 than their Mid and Top tier counterparts to break into the more elite academic IM programs. Given the similarity between these distributions, the better answer might simply be: Score high, period.
So myth debunked! there is no bias for more prestigious medical schools in IM resident selection. Well...let's not be too hasty.
What happens when we look at App Yield vs. Step 1 in the t8 IM cohort? After all, we can assume that these applicants regardless of what their medical school ranking is or isn't (or whatever their Step 1 scores are!) are the cream of the crop in many different dimensions of their CV.
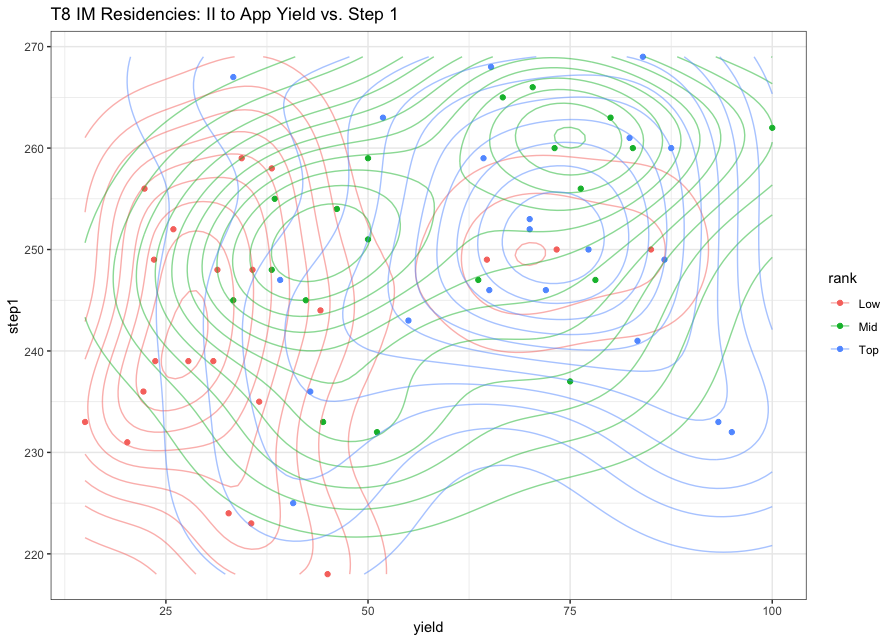
It appears that in this cohort of so-called "elite" IM applicants, students from higher ranked schools tend to, on average, have much better app yields at equivalent Step 1 score levels compared to their counterparts at lower ranked schools.
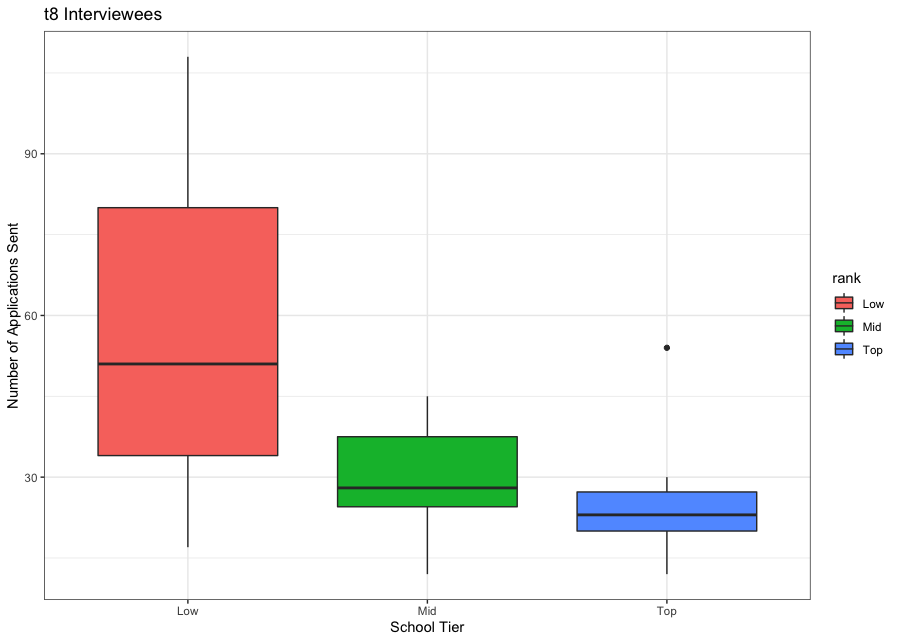
Furthermore, the difference between total number of apps sent by school tier here in the stratosphere of academic IM programs is much more pronounced.
Also, consider this:
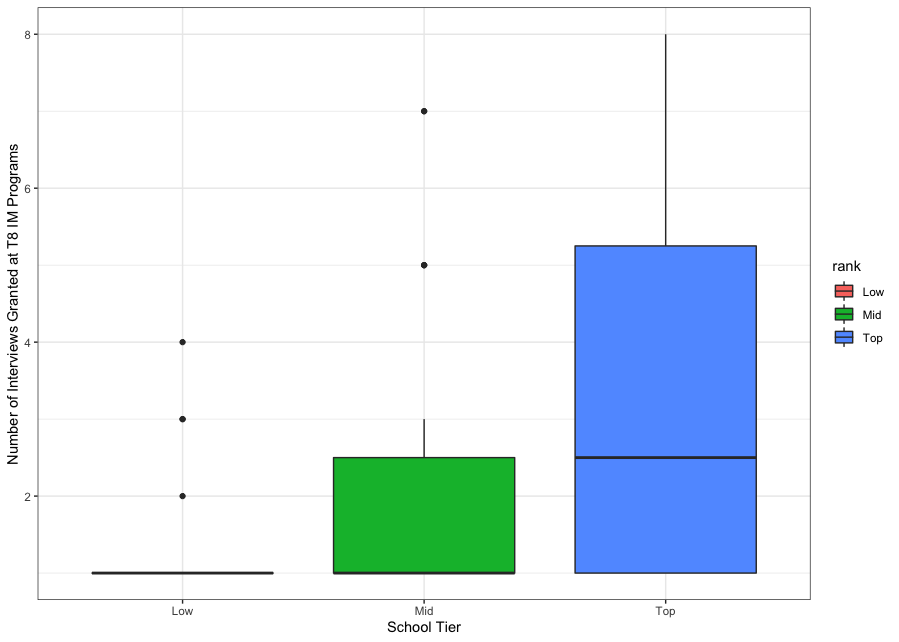
It was far more common for applicants from higher ranked schools to receive interview invitations to multiple of the T8 IM programs.
Although the data is highly limited, I thought it was interesting how well even this small snapshot was able to reproduce most of what we take to be basic wisdom about the way Step 1 score and school ranking are used in residency selection.
discuss
so every year, residency applicants on the internet will use spreadsheets to anonymously share information about interview invitations, experiences etc. Well, these spreadsheets also happen to have a wealth of information on the applicants themselves but the information has never, to my knowledge, been presented in a particularly helpful way. But Lucca, you might say, dont we have the NRMP Charting the Outcomes data, the best possible source of residency related information available to anyone???? Yes! That's completely right. But this is SDN where we also have endless arguments about things the AAMC (and probably no one else) doesnt care about, like how much the prestige of your med school matters. After doing some data cleaning I made up some graphs to try to extract some basic information from this snapshot of 171 anonymous IM applicants.
caveats and disclaimers:
-yes, this data is anonymous and comes from the internet so obviously grain of salt and all that
-this data (n=171) is a small fraction of the ~11,000 total US IM applicants so it's a snapshot. Think of it like shotgun sequencing a cup of water from a lake to get an idea of whats going on in the lake, but certainly not a thorough census of all life in the lake ecosystem.
-data cleaning: ppl often had funky answers to the school ranking question like Mid-Low tier (?????) so I've lumped all into just 3 buckets: Low, Mid, Top. DO and IMG were automatically sorted to the "Low" category. "Top" was reserved for people claiming Top tier or T20. Everything else was sorted into "Mid". N/A from the original spreadsheet data were removed for the sake of simplicity.
Now that the boring part is over let's look at some graphs.
here's the overall step 1 distributions by school tier:
obviously the folks on the IM spreadsheet tend to have pretty high Step 1s with the median floating around 240! Definitely not representative of the overall IM applicant population, but something good to keep in mind. There is also no meaningful difference from any of these distributions as far as Step 1 is concerned.
First, lets look at II to App Yield vs Step 1. Points are individual applicants. Density contours added to aid in visualization. App yield is defined as # of IIs / # of apps sent out.
These density maps are almost completely overlapping, with a clear trend for higher yields with increasing step 1 score. This suggests that looking at all potential IM programs in aggregate, Step 1 is a better predictor of overall App Yield compared to School Ranking. Matches up with the received wisdom passed down on Reddit/SDN. Neat.
That said, it looks like applicants from higher ranked medical schools tend to be more likely to send fewer applications (indeed, up to less than half as many) than those from lower ranked medical schools. The number of IMGs in this dataset is small enough that I don't think IMGs are skewing the low tier distribution.
Hmmm...but what happens when he zoom in on just the applicants who received an II to one of the Top 8 IM residencies as defined by the Top 100 rankings on the spreadsheet itself? Let's see what the Step 1 distributions look like for those programs as represented by applicants on the spreadsheet who reported receiving an invitation to one or more such places.
BWH = Brigham and Women's, MGH = Mass General, JHH = Hopkins. Only main-sites were included in this analysis, so places like UCSF-Fresno or Hopkins-Bayview were not counted with JHH or UCSF.
The Step 1 distributions for applicants reporting IIs at the T8 IM residencies are remarkably similar! Medians floating near 250 with short tails on the 25th percentile end and longer tails on the 75th percentile end, with the notable exceptions of Columbia and UCSF which appear to be more symmetrically distributed.
What does the school tier representation look like now that we've zoomed in on these so-called "top" programs?
Schools from all tiers appear to be pretty equally distributed across all T8 IM interviewees! We can more directly compare the difference in prevalence from the overall pool like this:
In other words, low and top tier schools are slightly overrepresented in the t8 Interviewee dataset compared to the overall IM spreadsheet applicant pool dataset; mid-tiers slightly underrepresented.
Have the step 1 distributions changed for applicants receiving IIs to T8 IM programs ?
Unsurprisingly, the distributions have jumped up on the Step 1 scale compared to the overall pool. Somewhat surprisingly, the distribution from the "Low" tier population his a bit lower than those in the mid and top tier bracket. This might challenge the oft-repeated wisdom that applicants from "lower tier" medical schools will have to score higher on Step 1 than their Mid and Top tier counterparts to break into the more elite academic IM programs. Given the similarity between these distributions, the better answer might simply be: Score high, period.
So myth debunked! there is no bias for more prestigious medical schools in IM resident selection. Well...let's not be too hasty.
What happens when we look at App Yield vs. Step 1 in the t8 IM cohort? After all, we can assume that these applicants regardless of what their medical school ranking is or isn't (or whatever their Step 1 scores are!) are the cream of the crop in many different dimensions of their CV.
It appears that in this cohort of so-called "elite" IM applicants, students from higher ranked schools tend to, on average, have much better app yields at equivalent Step 1 score levels compared to their counterparts at lower ranked schools.
Furthermore, the difference between total number of apps sent by school tier here in the stratosphere of academic IM programs is much more pronounced.
Also, consider this:
It was far more common for applicants from higher ranked schools to receive interview invitations to multiple of the T8 IM programs.
Although the data is highly limited, I thought it was interesting how well even this small snapshot was able to reproduce most of what we take to be basic wisdom about the way Step 1 score and school ranking are used in residency selection.
discuss
Last edited: