EKG questions

This forum made possible through the generous support of SDN members, donors, and sponsors. Thank you.

Kahldrogo

New Member
5+ Year Member
Joined
Jan 21, 2018
Messages
4
Reaction score
0
Hi all guys, I'm a soon to be medical doctor but I'm still concerned about some aspects of EKG (that i'm actually rewiewing :eyebrow:).

First of all I still don't understand some of the physics that lies behind it: how is it possible that the PQ tract is isoelettric if the atria are depolarized and the ventricles still polarized? Doesn't this form an electric dipole? I found the same question here (I'm not the only crazy one around here at least u.u):
Why is the PR interval flat?
but no one seemed able to answer properly imho and I would like to repost the question.
Second more clinical/less phylosophic question: I understand that in STEMI the EKG reports an ST elevation; still I don't understand why this is not preceded by an ST depression, infact we can see this kind of pattern (endocardic->epicardic) for the ischemic lesion (high peak t-wawe that becomes an inverted t-wawe) that preceeds the injury but not for the injury itself. Thanks for your kind answers 🙂

Members don't see this ad.
 
Try not to think too much into it and don't think of it as there being an electrical difference between the Atrium and Ventricles.

The atria and ventricles are electrically isolated from each other by the fibrous trigone and associated structures so the AV node is the only way conduction gets to the ventricles... with the exception of an accessory pathway of course.

In regards to the surface EKG... think of this as a wide angle/far-away view or "big picture" view of electrical activity. For something to show up on the surface EKG it has to involve a certain amount of myocardium depolarizing/repolarizing at once to be "visible" from far away.

Consider this; if a small LED light is a single myocardial cell you may be able to see it light up if you were looking at at from a few inches away, however you may not see if you then were a mile away. But if you then lit up a hundred LED lights all together you could probably see that from a mile away. In the EP lab we stick small catheters in various positions in the heart, sitting on the endocardial surface and can "see" small electrical signals originating from certain areas (like a HIS potential) that we don't see on a surface EKG.

So if the P wave is atrial depolarization, which involves a fair amount of myocardial mass depolarizing together you see that on the surface tracings. Atrial repolarization is usually slower and occurs later on usually during the ventricular depolarization so is obscured by the QRS complex and not seen. And of course the QRS complex is ventricular depolarization.

On to your PR (PQ) segment, during this time the atria have already depolarized, are still waiting until repolarization, and the ventricles are not doing anything waiting to depolarize and contract. Essentially the only electrical activity occurring during this time is activity down the AV node, the HIS bundle, bundle branches and purkinje fibers until it reaches the ventricular myocardium which we see as the QRS complex due to the larger mass of myocardium being activated. Conduction down the AV node/HIS/Bundles/Purkinje involves depolarization of very little actual tissue and thus we don't see this activity on the surface EKG, kind of like not seeing a single LED light from far away.

From a random google search I came across this PDF textbook link, that first page and graphic is a handy visualization of what's going on:
http://samples.jbpub.com/9780763773519/9780763773519_CH10lr_PASS03.pdf

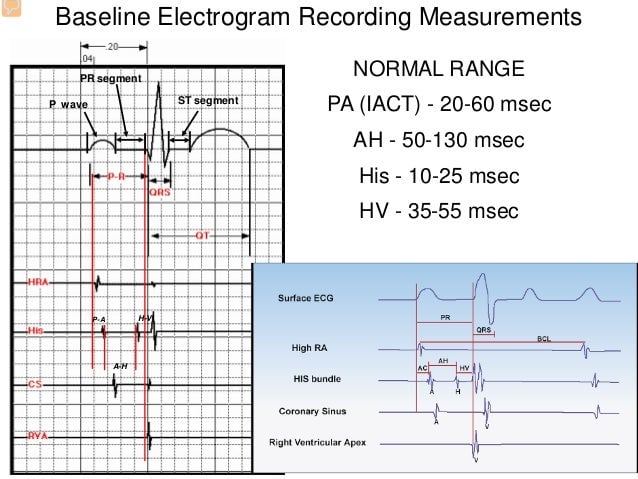
intracardiac-electrograms-82-638.jpg


Here's an example of what we see when we have catheters inside the heart measuring the electrical signals (intracardiac electrograms). If we take a catheter with a pair of conductors a few mm apart and place it along the endocardial surface near where the HIS bundle should be we see tracings similar to the above graphic along that "His" line. Notice there's a small signals (the sharp spiky signal labeled H) that falls right in the PR interval under that surface ECG tracing though is not seen there.
 
Hi Nlax, first of all huge thanks for your answer, I cannot not overthink about it otherwise I wouldn't be here 😉

Coming to business: I understand everything that you wrote:

-I understand that if the electric current is too small you cannot see it on the surface EKG
-I understand that you can instead see it if you place an electrode near the source of the current (as small as it can be)


The example of the LED light is appropriated but still I need to say (I don't wanna sound rough) You didn't answer my question. I'll try to explain myself (and the question) with an example: a battery inside a bowl. The heart in the PR (sorry for the previous coarse mistake) segment can basically be compared to a stilo battery:

-We have a minus pole (the depolarized atria)
-We have a plus pole (the polarized ventricula)
-We have not a direct passage of current inside the battery from the minus to the plus pole (we actually have it inside the heart through the AV node but since we cannot see it on the surface EKG, as you also stated, I think we can easily ignore this difference).

So here comes my question: if I put this battery inside the bowl (full of water, ionized water) and I use a Voltometer I can see a difference of potential (It may sound weird but I actually tried it); I don't understand why I don't see this difference of potential in the surface EKG; maybe there is something inside the electrocardiograph (a condenser, a magnetic field of some sort, I don't know) that accounts for this difference? It seems to me that what the EKG is really looking at is not the the potential itself but its variation in time.

I hope to have clarified myself.
 
Members don't see this ad :)
I think you kind of led yourself to it by that last sentence. The EKG is not showing us a resting potential, but a sum of multiple electrical vectors over time. So a static potential wouldn't be visible with no movement of conduction with a velocity and vector.
 
Nlax please don't get mad at me but:

-the presence of a (also static) potential should be per se sufficient to get a signal on a voltometer as I demonstrated with the battery example
-the potential doesn't need an electric current flow to exist, the potential can generate an electric flow but exists independently from it (eg: I have a difference of potential in my house socket, also, no current is flowing through it until I plug in something)
-Also giving for true what I said "the EKG is really looking not at the potential itself but its variation in time" (and I don't know if it is true) I still need to understand why this happens (ie: why the electrocardiographs doesn't see the static potential?)

I see this is more of a physic subject and not medical, but to sleep restful sleep i would like to know the answer.
 
I think this more of a physics thought experiment and while I applaud the curiosity, don't get caught up in the weeds if it's clinical relevant EKG material you wish to learn.

Having said that, if you want to geek out on some of the tech and theory behind the EKG you can check out this paper:
Recommendations for the standardization and interpretation of the electrocardiogram: part I: The electrocardiogram and its technology: a scientific... - PubMed - NCBI
There's a series of guideline papers put out by the the AHA on EKG standardization and interpretation and that link is Part 1 dealing with the technology and how an EKG is derived.

Also, with your battery example, when you stick a voltmeter across a circuit you do technically alter the circuit a little bit. Current has to flow for the meter to measure voltage. Modern meters seek to minimize the effect on the circuit but it does change it a tiny bit. If you're checking your car's tire pressure a very small amount of air has to travel into the gauge for it read the pressure.

In my mind, granted I'm pretty far into clinical training that it could be hard to think of something in a different way than I have for many years.... but I still think the principle of viewing the surface EKG as being a summed recording over time of many many different changing electrical vectors in the heart is probably the easiest conceptual way of putting things together in your head. At any given time during atrial and ventricular contraction there are many small vectors formed as the depolarizing wavefront spreads from myocardial cell to cell. Add all these vectors up and you get the EKG. During the isoelectric portion of the PR segment there are no active vectors to view. While I guess it's true that the atrium are awaiting repolarization and the ventricles are still at their resting potential, there's no flow (and hence no active vectors) directly from the atrium to the ventricles.
 
Top