- Joined
- Jul 7, 2007
- Messages
- 593
- Reaction score
- 2
see topic

too bad they don't have any data from the az do schools.
Those stats have to be off, LECOM doesn't enroll 350 students or so😕
Start in the top right hand corner of the chart and proceed right until you see the "Enrolled" box. Now, count down 6 boxes until you see the numbers 123 & 266, which correspong to enrolled students in-state and out of state respectively. 123+266= 389. LECOM is one of the largest osteo. medical schools, so these numbers are probably very accurate.
Start in the top right hand corner of the chart and proceed right until you see the "Enrolled" box. Now, count down 6 boxes until you see the numbers 123 & 266, which correspong to enrolled students in-state and out of state respectively. 123+266= 389. LECOM is one of the largest osteo. medical schools, so these numbers are probably very accurate.
... 123+266= 389. LECOM is one of the largest osteo. medical schools, so these numbers are probably very accurate.
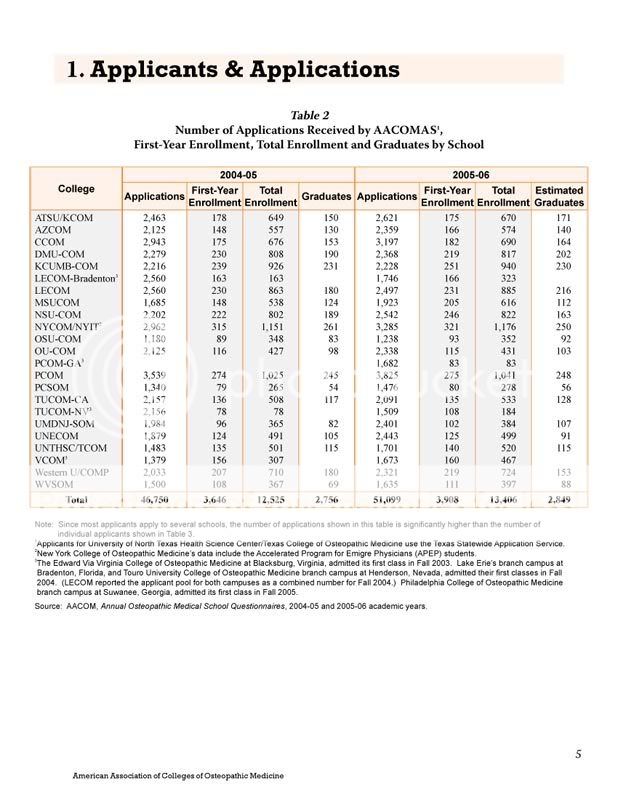
Does anyone know how many of those that applied actually went to an allopathic school instead.
I have been told that most schools lose approximately 10% of their class along the way.I wounder if the allopathic schools have the same ratio of Enrolled vs graduated

