You are using an out of date browser. It may not display this or other websites correctly.
You should upgrade or use an alternative browser.
You should upgrade or use an alternative browser.

- Joined
- Feb 24, 2012
- Messages
- 13
- Reaction score
- 0
- Points
- 0
- Pre-Medical
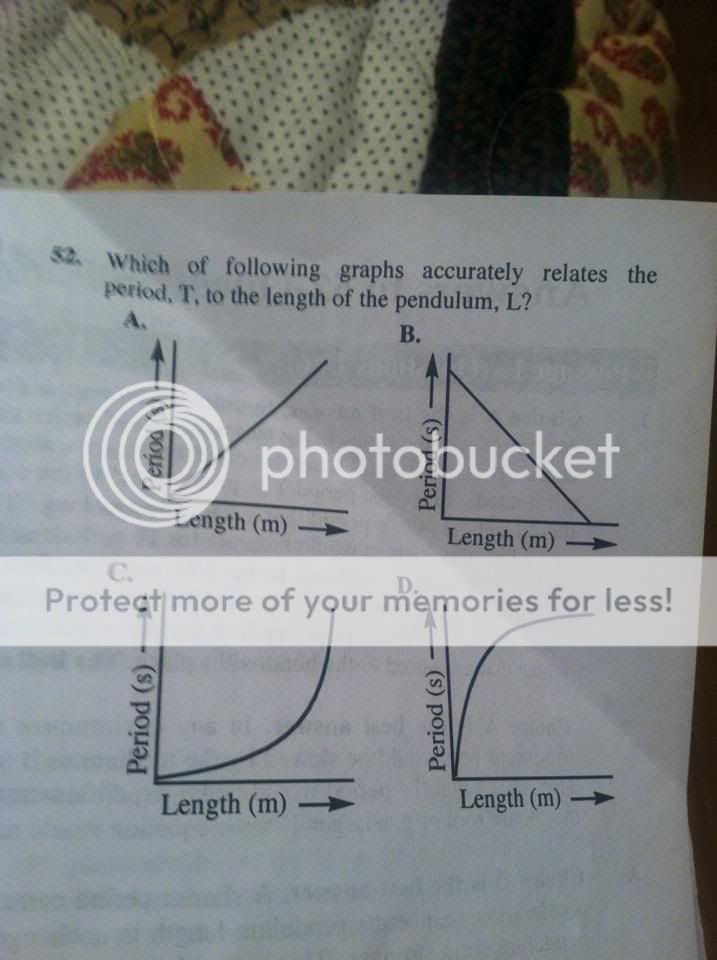
TBR says it's D but I said C. The answer explanation says it bends toward the axis with greatest change and says the X axis is the greatest change. Correct me if im wrong, but isnt it bending towards the x axis in C?
D starts off with a slope similar to the y axis and ends up with a slope similar to the x axis.
C does the opposite.
according to the formula T^2 is proportional to L so as T increases a little bit L will increase alot. When looking at graphs that has direct proportionality the graph curves toward the item that increases alot. In this case it is L . So the answer is D and it is curving toward the X-axis which is L
TBR says it's D but I said C. The answer explanation says it bends toward the axis with greatest change and says the X axis is the greatest change. Correct me if im wrong, but isnt it bending towards the x axis in C?
- Joined
- Dec 1, 2011
- Messages
- 18,577
- Reaction score
- 57
- Points
- 4,641
- Pre-Podiatry
Nm, I get it I just had to look at it again. D corresponds to exponential change in length. I just have trouble applying their "curve to" method it confuses mean by what they mean by that exactly.
Yea that method/shortcut is probably the only thing in TBR that I have not incorporated into my strategy. It doesn't make sense to me either.
I can pick out the best answer, but looking at this again I'm not completely sure why the graph flattens out as L increases?
- Joined
- Apr 6, 2010
- Messages
- 2,439
- Reaction score
- 4
- Points
- 4,551
- Medical Student
Yea that method/shortcut is probably the only thing in TBR that I have not incorporated into my strategy. It doesn't make sense to me either.
I can pick out the best answer, but looking at this again I'm not completely sure why the graph flattens out as L increases?
assuming we all know the equation
it's T α sqrt(L)
y = sqrt(x)
- Joined
- Dec 1, 2011
- Messages
- 18,577
- Reaction score
- 57
- Points
- 4,641
- Pre-Podiatry
Yea but that graph (the one you linked to) doesn't plateau nearly as quickly as the TBR graph. I know it's the best answer, but it's not entirely accurate is it?
- Joined
- Apr 6, 2010
- Messages
- 2,439
- Reaction score
- 4
- Points
- 4,551
- Medical Student
Yea but that graph (the one you linked to) doesn't plateau nearly as quickly as the TBR graph. I know it's the best answer, but it's not entirely accurate is it?
i don't know my math well enough to answer, but either way it's the best answer by far.
- Joined
- Dec 30, 2009
- Messages
- 2,640
- Reaction score
- 527
- Points
- 5,171
- Location
- Where the rain grows
- Pre-Medical
It's as goog as it will get without any sort of unit on the x and y axises. D is the only graph that can be considered as estimation of sqrt(x). It's increasing and has a negative second derivative (the "speed" with which it increases gets smaller and smaller). C can be an estimation of x^2.
---
I am here: http://tapatalk.com/map.php?tffaqc
---
I am here: http://tapatalk.com/map.php?tffaqc
- Joined
- Jul 18, 2008
- Messages
- 6,234
- Reaction score
- 1,658
- Points
- 5,171
If you choose C then you're saying that for some finite pendulum length, the period will be infinity. Does this sound like a physical possibility?
Advertisement - Members don't see this ad
- Joined
- Jul 18, 2008
- Messages
- 6,234
- Reaction score
- 1,658
- Points
- 5,171
Like I said, I can pick out the best answer, but I wasn't necessarily sure that the shape of the graph in D is completely accurate.
Yeah, TBR loves to do that. "Accurately" can mean "most accurately" or it can mean "exactly."
4
411309
Like I said, I can pick out the best answer, but I wasn't necessarily sure that the shape of the graph in D is completely accurate.
I agree. We can't exactly go into debate about infinite but still. Sometimes these graph questions annoy me.
- Joined
- Dec 30, 2009
- Messages
- 2,640
- Reaction score
- 527
- Points
- 5,171
- Location
- Where the rain grows
- Pre-Medical

Here's sqrt(x), you can decide for yourself if the resemblance is good enough or not.

And x^2, just for reference.
- Joined
- Apr 6, 2010
- Messages
- 2,439
- Reaction score
- 4
- Points
- 4,551
- Medical Student
Here's sqrt(x), you can decide for yourself if the resemblance is good enough or not.
And x^2, just for reference.
What software do you use?
- Joined
- Dec 30, 2009
- Messages
- 2,640
- Reaction score
- 527
- Points
- 5,171
- Location
- Where the rain grows
- Pre-Medical
What software do you use?
Mathematica. You can write a single line and then right click the graphic and save it as an image file. 👍
- Joined
- Apr 6, 2010
- Messages
- 2,439
- Reaction score
- 4
- Points
- 4,551
- Medical Student
Mathematica. You can write a single line and then right click the graphic and save it as an image file. 👍
Handy. And expensive!
- Joined
- Dec 30, 2009
- Messages
- 2,640
- Reaction score
- 527
- Points
- 5,171
- Location
- Where the rain grows
- Pre-Medical
Handy. And expensive!
It was that or doing homework by hand in my calculus classes last year. There is only so much mindnumbing boredom that I can tolerate. 😉