- Joined
- Apr 6, 2014
- Messages
- 14,146
- Reaction score
- 22,782
Hello everybody. Another slower day so I decided to try and kill some time looking at AAMC's tables A-3 and A-4, Applicants and Matriculants by State of Residence.
The only vaguely interesting question I could come up with for myself was about how uniform the numbers might look, after adjusting for the population sizes of regions and states.
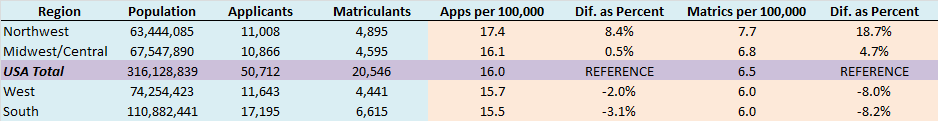
First fun fact: In a random sample of 100,000 US residents taken during last cycle, you should get that about 16.0 applied to allopathic medical schools that year, and 6.5 matriculated!
Second fun fact: The overall regions (as classified by AAMC in their tables, minus Puerto Rico) all look fairly close to the national numbers. And, the trend for matriculation was similar to application. [Northwest should be Northeast]
Third fun fact: At the state level that falls apart a lot. There is a great deal of variation between states within every region - for example Massachusetts had considerably more Apps per 100k than the nation, while Maine and New Hampshire had far fewer. Often the number of matriculants is much higher or lower than you might expect from the number of applicants. Here are the top and bottom five states for Yearly Applicants and Matriculants per 100,000 Residents.
5 Highest and Lowest for Apps:
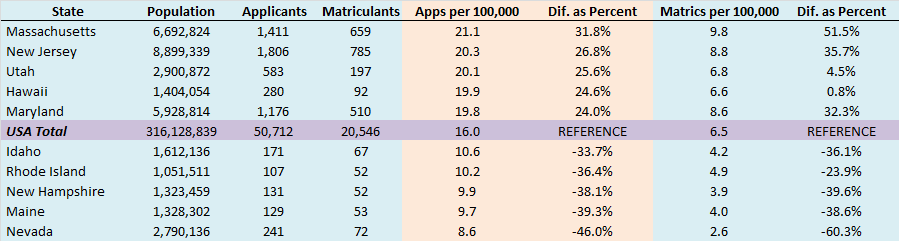
5 Highest and Lowest for Matrics:
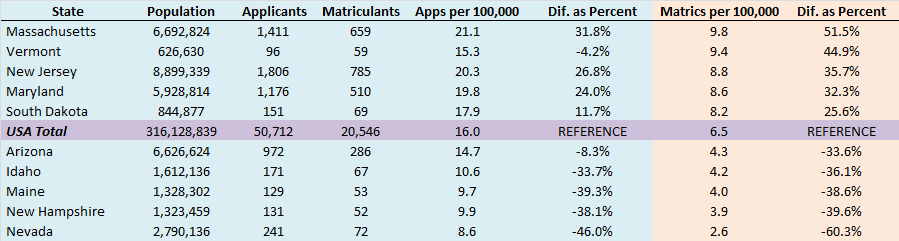
As you can see there are some odd ones, like Vermont falling a little short of the overall rate of application, yet coming out about 50% greater than the overall rate of matriculation.
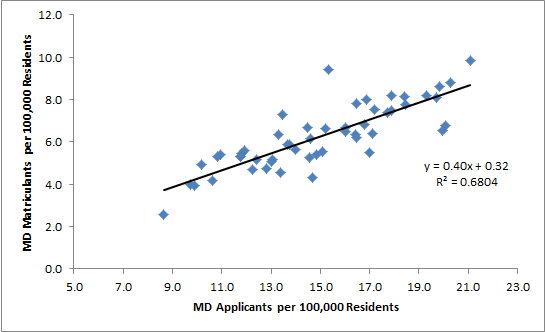
For the full set though, the trend holds well:
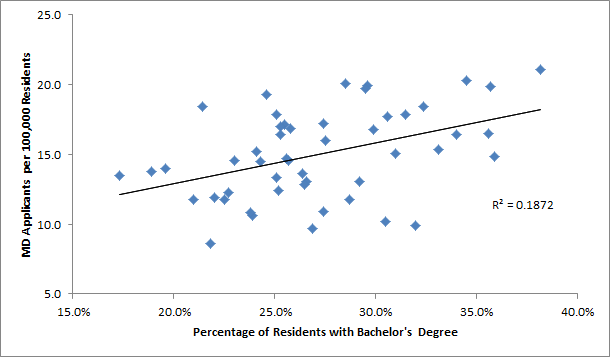
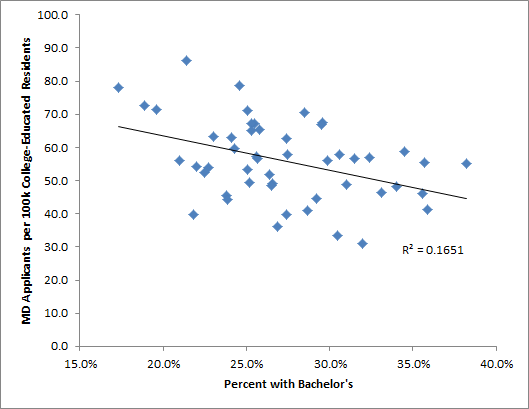
Of course, none of this is adjusting at all for average stats, number of public school seats, percentage of the state population that attends college or graduate school, percentage that lives in cities, SES, etc.
As always you can check out the data in a google spreadsheet here or just see an image of the table of all states here (sorted by app) or here (sorted by matric).
The only vaguely interesting question I could come up with for myself was about how uniform the numbers might look, after adjusting for the population sizes of regions and states.
First fun fact: In a random sample of 100,000 US residents taken during last cycle, you should get that about 16.0 applied to allopathic medical schools that year, and 6.5 matriculated!
Second fun fact: The overall regions (as classified by AAMC in their tables, minus Puerto Rico) all look fairly close to the national numbers. And, the trend for matriculation was similar to application. [Northwest should be Northeast]
Third fun fact: At the state level that falls apart a lot. There is a great deal of variation between states within every region - for example Massachusetts had considerably more Apps per 100k than the nation, while Maine and New Hampshire had far fewer. Often the number of matriculants is much higher or lower than you might expect from the number of applicants. Here are the top and bottom five states for Yearly Applicants and Matriculants per 100,000 Residents.
5 Highest and Lowest for Apps:
5 Highest and Lowest for Matrics:
As you can see there are some odd ones, like Vermont falling a little short of the overall rate of application, yet coming out about 50% greater than the overall rate of matriculation.
For the full set though, the trend holds well:
Of course, none of this is adjusting at all for average stats, number of public school seats, percentage of the state population that attends college or graduate school, percentage that lives in cities, SES, etc.
As always you can check out the data in a google spreadsheet here or just see an image of the table of all states here (sorted by app) or here (sorted by matric).
Last edited: