- Joined
- Apr 20, 2014
- Messages
- 2,440
- Reaction score
- 5,521
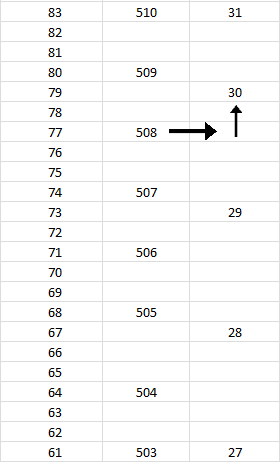
I am not misunderstanding percentiles, you are misunderstanding ranges. Each scaled score accounts for a range of percentiles. There are multiple raw scores on the MCAT that convert to the same scaled score. For example, a 74% correct and a 76% correct may both convert to a 31 (totally hypothetical), but they first converted to different percentiles. Each scaled score has a range of percentiles that it encompasses, but only the ceiling of that percentile range is listed.
Read the legend on the conversion chart. It explicitly states that the listed percentile is the ceiling of that score, and each percentage listed includes that percentage and those below it. Do you honestly think that on a 230 question test you can only score either 77th percentile or 80th? No, there are percentiles in between those, but they get clumped into one scaled score.
Read the legend on the conversion chart. It explicitly states that the listed percentile is the ceiling of that score, and each percentage listed includes that percentage and those below it. Do you honestly think that on a 230 question test you can only score either 77th percentile or 80th? No, there are percentiles in between those, but they get clumped into one scaled score.