- Joined
- May 4, 2016
- Messages
- 27
- Reaction score
- 10
Hey guys!
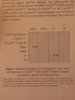
So one of my weak points is interpreting graphical data. In the EK 30 min exam for lecture 1, Passage 1, I'm having trouble interpreting the graph. What exactly do the "+" and "-" signs denote? Are there multiple trials that are carried out? I would really appreciate if someone could clear this up for me. Thank you and happy studying!
(note: please don't be nasty and condescending in the comments)