Alright I think I found a way to non-arbitrarily combine all the data to measure changes in competitiveness. The bottom line here is that average matriculant data doesn't do us much good, because you don't need to be at that average
LizzyM score to get into med school, you only need to be above the acceptance-rejection threshold (i.e. you need to get to a LizzyM where you're at the percentile of all applicants that is just above the percent of applicants who are rejected). Without having to arbitrarily divide LizzyM by Matric% or anything like that, we can just find the LizzyM score at that "threshold" percentile, since both the percentile and corresponding LizzyM score will change dynamically and non-arbitrarily every year.
Let me know what you think of this
@efle @Lawper @Lucca
I'm in a bit of a rush so I've only calculated all of this for the past four years.
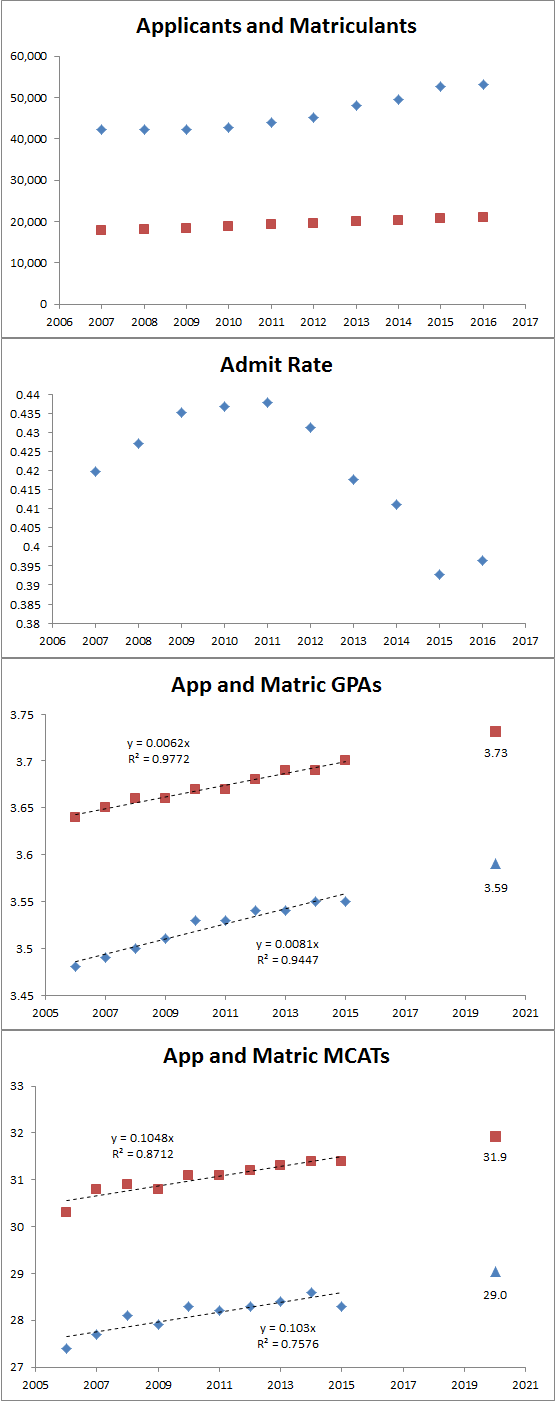
Acceptance rates:
View attachment 215515
100-Acceptance rates = threshold percentile of applicant pool that applicants must reach
View attachment 215516
Based on changes in GPA averages over the years, these are the GPA's necessary to reach the changing thresholds of the overall applicant pool based on changing acceptance rates (and based on a GPA SD of .34 which was accurate for 2016, but not necessarily accurate for the other years, though it should be close enough)
View attachment 215517
Same process for the MCAT
View attachment 215518
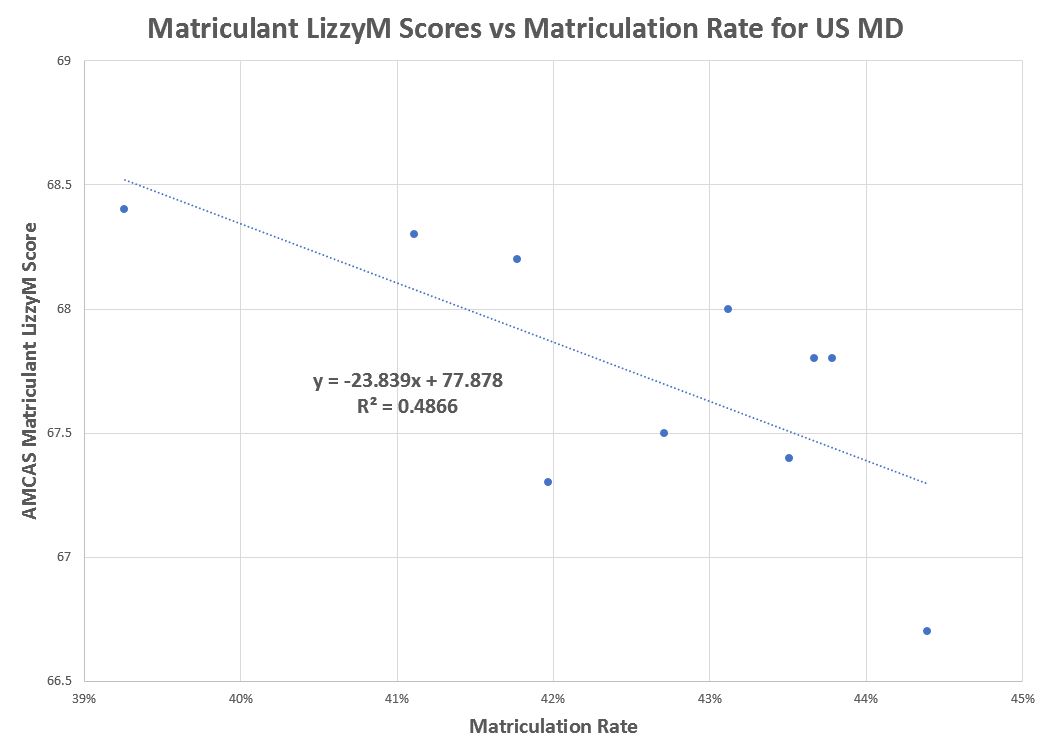
Combining those dynamic GPA percentiles, MCAT percentiles, and applicant pool thresholds based on acceptance rate changes, here's a plot of LizzyM scores needed to reach the relevant acceptance thresholds. I believe these LizzyM scores can pretty reasonably be considered "competitiveness" scores for the overall applicant pools.
View attachment 215520

 )
)