
- Joined
- Jun 17, 2014
- Messages
- 63,099
- Reaction score
- 154,727
So a recent thread this morning asking about the long-term trends of medical school admissions resulted in some nice charts and figures. I decided to make a separate thread to emphasize these findings, and focus specifically on trends in GPAs, MCATs and LizzyM scores.
Thanks to @efle for taking the time to construct these figures for US MD admissions (data were gathered from AAMC Table A-16.)
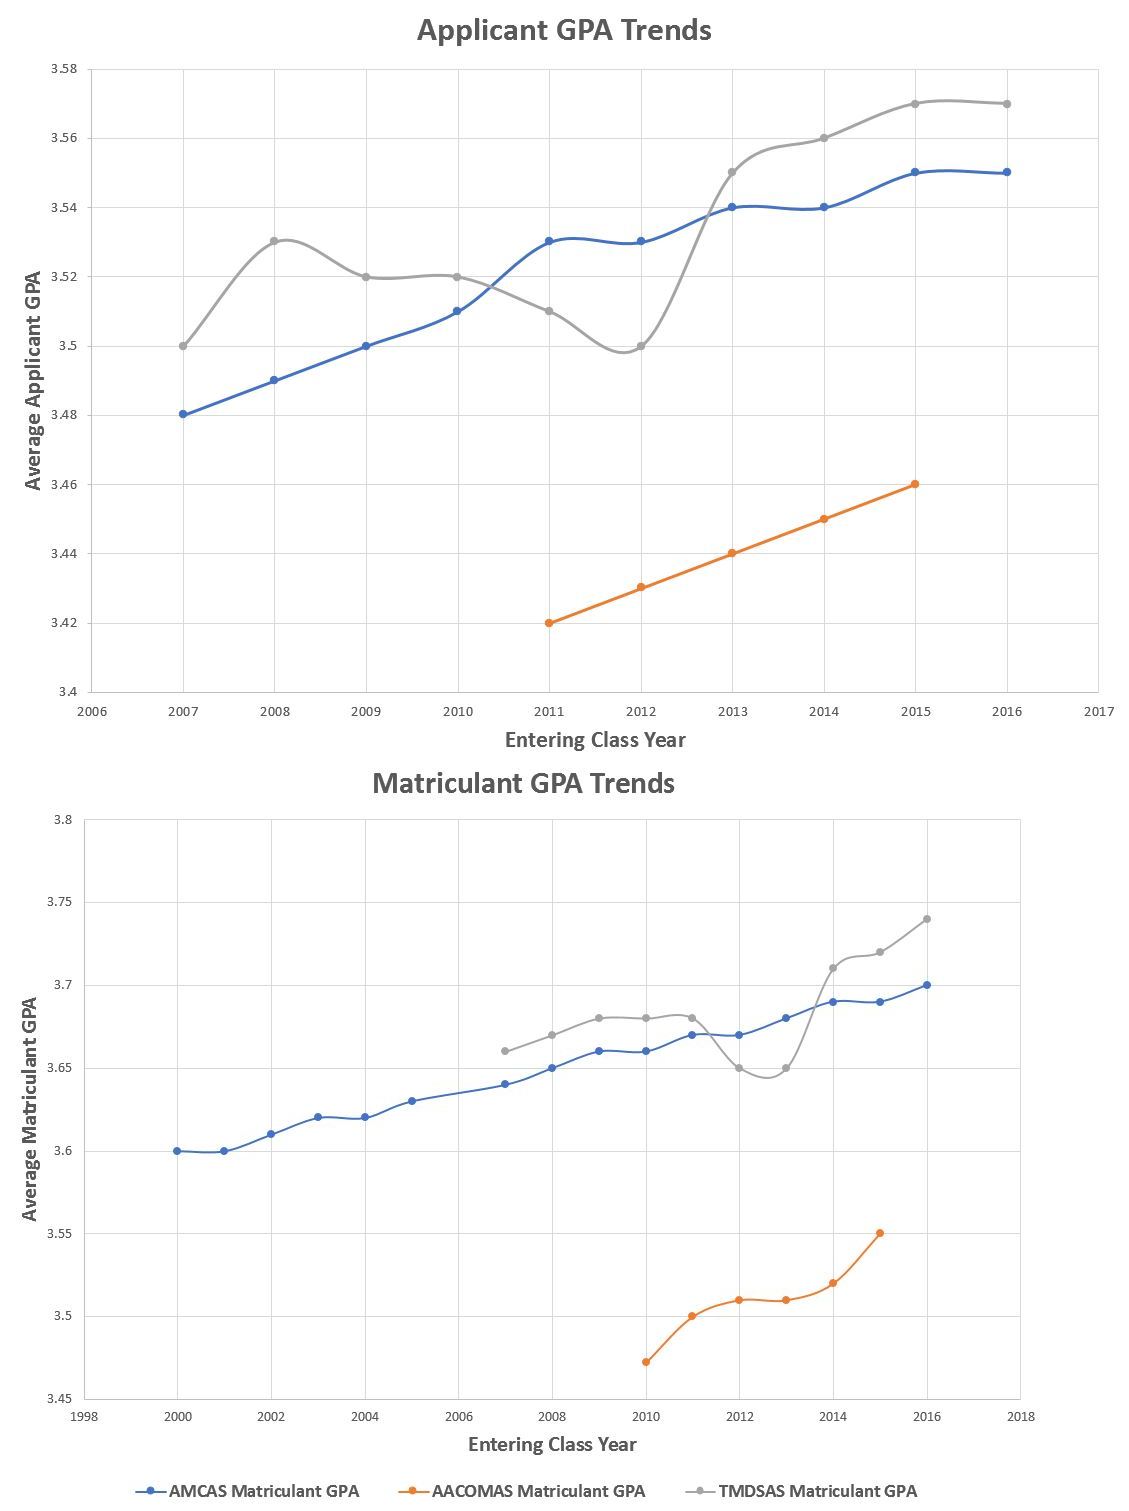
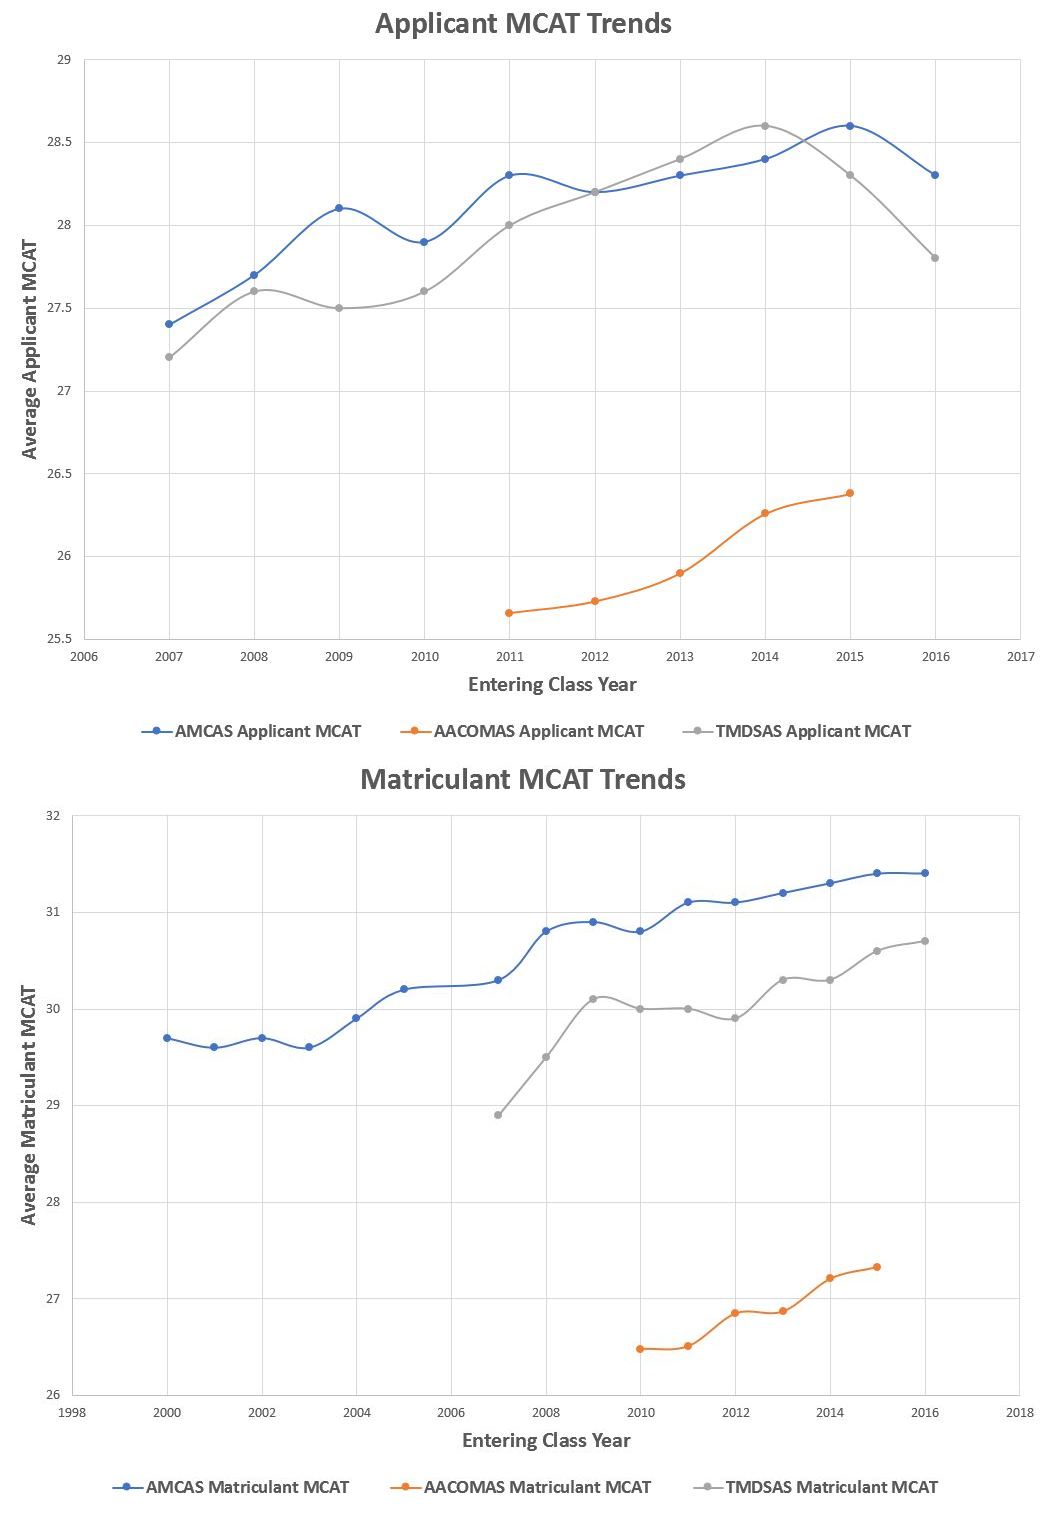
Below are the updated charts to include: AMCAS matriculant MCAT and GPA data from 2000-2005, AACOMAS MCAT and GPA data from 2010-2015, and TMDSAS MCAT and GPA data from 2007-2016.
Sources for the data:
Applicants:
http://www.aacom.org/docs/default-source/data-and-trends/2011-14-AProfRpt.pdf?sfvrsn=26
http://www.aacom.org/docs/default-source/data-and-trends/2012-15-app-report.pdf?sfvrsn=10
https://www.tmdsas.com/medical/application-statistics.html
Matriculants:
https://www.studentdoctor.net/2009/04/gpa-and-mcat/
http://www.aacom.org/news-and-event...ntering-class-of-osteopathic-medical-students
https://www.aacom.org/docs/default-source/archive-data-and-trends/2011-Mat.pdf?sfvrsn=10
http://www.aacom.org/docs/default-source/data-and-trends/2012-15-matprofilerpt.pdf?sfvrsn=8
https://www.tmdsas.com/medical/application-statistics.html
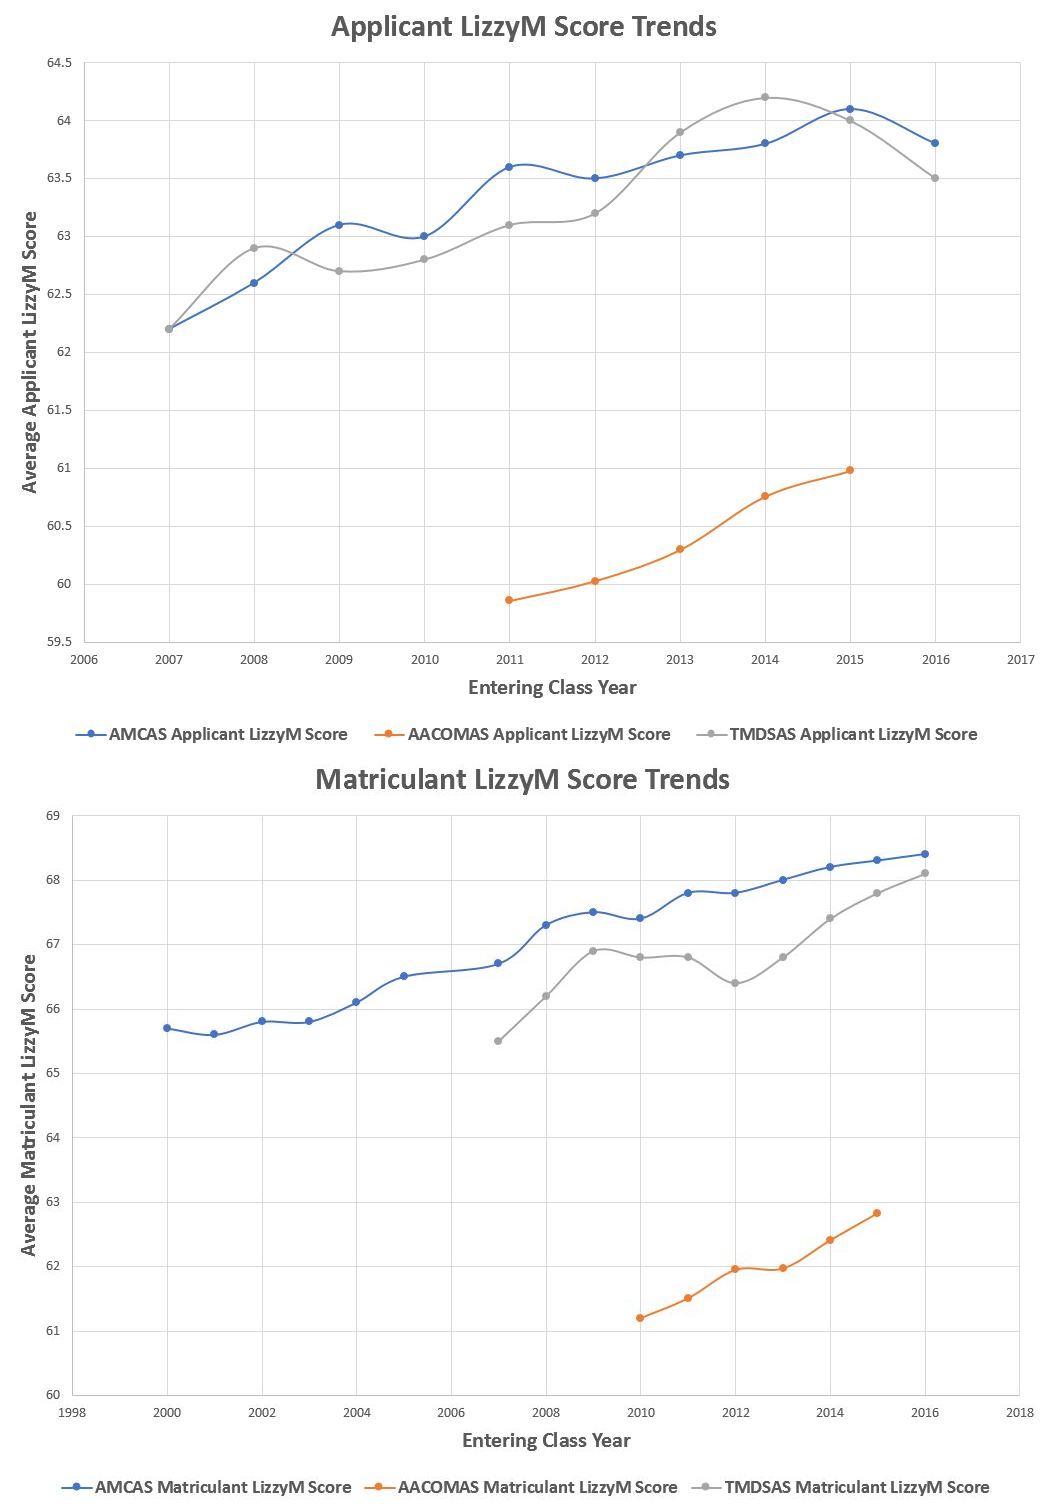
Mean GPAs and mean MCATs were used. LizzyM scores are calculated using the formula: LizzyM = 10*GPA + MCAT. I didn't extrapolate or conduct linear regression since I was more focused on long-term trends.
Enjoy!
GPA Trends
MCAT Trends
LizzyM Score Trends
Thanks to @efle for taking the time to construct these figures for US MD admissions (data were gathered from AAMC Table A-16.)
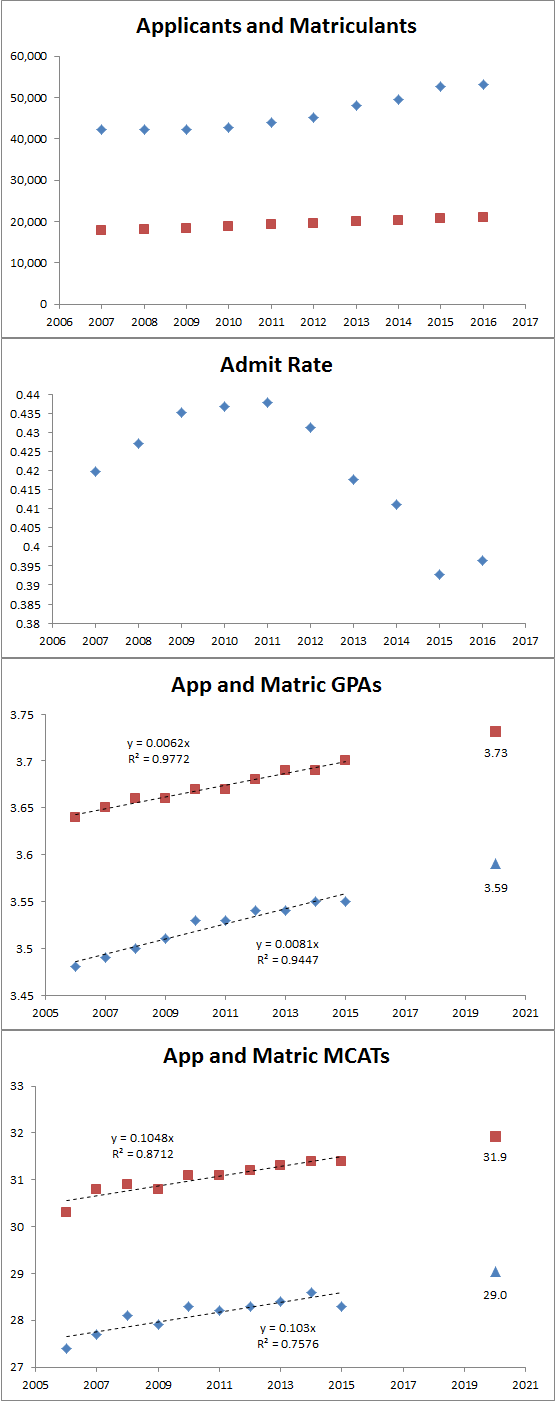
I'm not gonna try to extrapolate off the data 5-10 years into the future for apps/matrics because as you can see it's not a nice linear trend. I did go ahead and add a point for GPA and MCAT (old) in the 2020-2021 cycle if the trends there had held.
I think the new MCAT is going to make things weird for a cycle or two and I have no idea at all about what the EC expectations were like 5-10 years ago vs now.
Below are the updated charts to include: AMCAS matriculant MCAT and GPA data from 2000-2005, AACOMAS MCAT and GPA data from 2010-2015, and TMDSAS MCAT and GPA data from 2007-2016.
Sources for the data:
Applicants:
http://www.aacom.org/docs/default-source/data-and-trends/2011-14-AProfRpt.pdf?sfvrsn=26
http://www.aacom.org/docs/default-source/data-and-trends/2012-15-app-report.pdf?sfvrsn=10
https://www.tmdsas.com/medical/application-statistics.html
Matriculants:
https://www.studentdoctor.net/2009/04/gpa-and-mcat/
http://www.aacom.org/news-and-event...ntering-class-of-osteopathic-medical-students
https://www.aacom.org/docs/default-source/archive-data-and-trends/2011-Mat.pdf?sfvrsn=10
http://www.aacom.org/docs/default-source/data-and-trends/2012-15-matprofilerpt.pdf?sfvrsn=8
https://www.tmdsas.com/medical/application-statistics.html
Mean GPAs and mean MCATs were used. LizzyM scores are calculated using the formula: LizzyM = 10*GPA + MCAT. I didn't extrapolate or conduct linear regression since I was more focused on long-term trends.
Enjoy!
GPA Trends
MCAT Trends
LizzyM Score Trends
") )
)