- Joined
- Jun 7, 2019
- Messages
- 1,021
- Reaction score
- 1,115
Quite the eloquent response.Blah blah blah
Hey I was off by 39 cents; shoot me 😂

Quite the eloquent response.Blah blah blah
Oh really? I didn’t see a date on your prognostication that you parroted from some show or website.Quite the eloquent response.
Hey I was off by 39 cents; shoot me 😂
Nah they all talk moving averages which I don't look at. I look at trendlines and support/resistance levels with my eyeballs.Oh really? I didn’t see a date on your prognostication that you parroted from some show or website.
I examine the entrails of financial professionals during their laparoscopies to divine future direction of markets.Nah they all talk moving averages which I don't look at. I look at trendlines and support/resistance levels with my eyeballs.
Nah they all talk moving averages which I don't look at. I look at trendlines and support/resistance levels with my eyeballs.
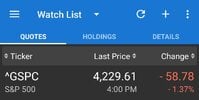
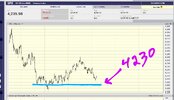
Held 4230 today like a champ.
Very oversold RSI.
Looked strong if long.
I closed all long positions short time ago.
Whichever way it goes off 4230 should be a wild ride either direction.
Personally I am negative on conditions but with just an avalanche of oversold fear I don't have overwhelming conviction and will sit back and enjoy the show 🍿.
The calm before the storm.
I think the GOP in the House will end up shutting down the govt. for 4-8 weeks. It could be the longest shutdown in US history. The new Speaker will be far more right/hawkish on the debt so the Dems made a mistake IMHO in voting to get rid of McCarthy. The country will suffer as a result but the House GOP is unlikely to vote for any budget which doesn't cut spending and address the border crisis. The Senate won't go along with the House leading to a shutdown.4200 is the 200 day moving average. things getting interesting..
and now McCarthy removed as Speaker lol. i think the market not gonna like uncertainty.
I would love that end scenario of the government standoff. But like many I've given up that we ever see some fiscal improvement in Congress.I think the GOP in the House will end up shutting down the govt. for 4-8 weeks. It could be the longest shutdown in US history. The new Speaker will be far more right/hawkish on the debt so the Dems made a mistake IMHO in voting to get rid of McCarthy. The country will suffer as a result but the House GOP is unlikely to vote for any budget which doesn't cut spending and address the border crisis. The Senate won't go along with the House leading to a shutdown.
Eventually, the Senate will agree to a 2-3% cut in domestic spending and some border/immigrant fixes. This could take 2 months. Biden will be forced to sign the package or the govt. remains in shutdown mode.
Any market rally will be short lived as the volatility towards 2024 will be high. I expect a retrace to 4190 or so on the S and P 500. That said, I did some nibbling at 4300. The market remains over-valued based on P/E and interest rates. I expect 1 more Fed rate hike of 0.25% next month.
Not "at fault" but they had a political animal in McCarthy willing to compromise with them. Now, they get a hard right House Speaker which may good politically for the Dems but bad for the country. When you vote party over country at critical junctions like this one, it's bad for the nation. Anyone who can't see voting out a moderate House Speaker for a hard right replacement isn't good for the nation is a political hack.Gotta love how the Democrats are at fault for the speaker of the house debacle. In previous years did the Republicans vote for Pelosi?
Accountability, wherefore art thou?
Matt Gaetz won't stop until he gets some cuts. In the end, it will be 2% but then he claims victory. The border issue is the real crisis at this time and I have never seen 6-7 million illegals enter this country over 3 years. These people will need housing, food, resources, etc and 90% of them do not qualify for asylum.I would love that end scenario of the government standoff. But like many I've given up that we ever see some fiscal improvement in Congress.

 thehill.com
Not "at fault" but they had a political animal in McCarthy willing to compromise with them. Now, they get a hard right House Speaker which may good politically for the Dems but bad for the country. When you vote party over country at critical junctions like this one, it's bad for the nation. Anyone who can't see voting out a moderate House Speaker for a hard right replacement isn't good for the nation is a political hack.
They already did that and he failed.What they should have done is gotten some major concessions from McCarthy in exchange for keeping his speakership.
I would shoot myself in the head before doing this as a career. When it consumes me it's 24/7 and loss of sleep, and then periods of months to even years of not checking anything. Not exactly a good business model.If what you do worked at all, you should be running a hedge fund and taking over the world, unfortunately…
That’s all masturbation. There are support levels because other investors are responding to the charts. The chart isn’t a reflection of some underlying truth. It’s the CAUSE of the support.I would shoot myself in the head before doing this as a career. When it consumes me it's 24/7 and loss of sleep, and then periods of months to even years of not checking anything. Not exactly a good business model.
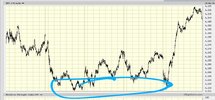
No coincidence the market dropped to that "magical" level again before bouncing (4230,4220, whatever; you're talking a meaningless zero point two percent difference with an infinite number of factors at play). People that think support levels are random imaginary luck fall into 2 categories, they don't have the math type aptitude to see it, or they simply don't care enough to learn about it. But the idea that stock movements, where they find resistance and support, and the channels, trendlines and patterns they go up and down in are just imaginary fairy dust is, to be blunt, idiotic.
And typically the next comment is why don't people that look at charts have billions? First you have to be highly math gifted to even consider having a chance at high success of trading stocks which eliminates over 99% right off the top, so there's that. Secondly, knowing where support is, where it's bumping the upper line of a channel, etc doesn't necessarily tell you it's going to hold that support or break through. It does give you small edges which are really cool when you actually apply them, such as I want to buy this falling knife. 99% of the time in a free fall you can wait at least till the next support level for a better price. Again, no assurance it won't break that support but you saved money waiting for a more probable buy point.
Which brings to third, it's all about probabilities. It doesn't guarantee success if you are accurately reading the situation. You may be wrong but over time if you've adding 20% better odds than flipping a coin in a number of situations (not all situations because often charts add nothing. You can't find a helpful pattern to it) then overall you are helping yourself.
Lastly, most importantly, I find the fraction that can control their emotions is less than the fraction of highly gifted math iq. Multiply the 2 together and get a really low number. Probably every single person that starts out trying to be a day trader makes dozens and dozens of addictive excessive moves often in a single day that if he were grading someone else he would say there was no good basis for these trades. How often are addictive endeavors successful? Been there done that, years past doing any of that anymore. But the fear/greed still to this day rattles me. I'll be on a perfectly mapped out trade, and like every other emotionally rattle person, it goes down a little and, damn am I wrong?, sell a little, heads back up, I knew I was right, buy it back. Sell low, buy high, not a good strategy. That see saw backwards nervous activity can take a basically perfectly mapped out stock movement, nailed the run up, the resistance level, the pullback, etc and when it's over leaving you breaking even or even losing money. And then a whole other issue of being wrong, not admitting it didn't work out, not getting out, and taking an unnecessary massive loss. None of these emotional shortfalls are the fault of repetitive chart patterns that are formed from highly repetitive human psychology.
Therefore I don't recommend day trading to anyone. The ideal rare cyborg human perfectly built for it can be successful and there is a very very small number that consistently are (key words, same people, consistently, so it can't be random luck for them). But getting back to earlier statements that support levels are blah blah blah nonsense is just idiotic. Seeing it bounce off the 4230ish all week long should tell you the mathematical probability of hitting that same spot over and over being luck is excessively small.
What are the forum's opinions regarding uranium and optimal way to acquire exposure to it?
Take a trip to Chernobyl or Fukushima.
Sir, this is a Wendy’s.What are the forum's opinions regarding uranium and optimal way to acquire exposure to it, if exposure to uranium is a thing which one should be acquiring?
Is this post your way of winning a free trip to Guantanamo?What are the forum's opinions regarding uranium and optimal way to acquire exposure to it, if exposure to uranium is a thing which one should be acquiring?
What are the forum's opinions regarding uranium and optimal way to acquire exposure to it, if exposure to uranium is a thing which one should be acquiring?
I don't think so. If the Friday bounce continues then no one obviously cares. If stocks reverse from Friday continuing in their 2 months long sharp sell off I'm sure people will say it's due to the war simply because that's what financial media do, they pick from the endless news items each day and say that's why stocks moved. Sometimes they'll go back and forth between blaming the same two alternate news items multiple times in the same week or even same day as the markets reverse direction multiple times over that period. It's almost comical. But in reality, I don't think this battling has true market movement potential until you see real potential of world involvement.This new war affect stock sentiment next week
it looks like the war is causing stocks to rally since more are believing fed wont increase. bond yields tanked todayI don't think so. If the Friday bounce continues then no one obviously cares. If stocks reverse from Friday continuing in their 2 months long sharp sell off I'm sure people will say it's due to the war simply because that's what financial media do, they pick from the endless news items each day and say that's why stocks moved. Sometimes they'll go back and forth between blaming the same two alternate news items multiple times in the same week or even same day as the markets reverse direction multiple times over that period. It's almost comical. But in reality, I don't think this battling has true market movement potential until you see real potential of world involvement.
Could be.it looks like the war is causing stocks to rally since more are believing fed wont increase. bond yields tanked today

Treasury bond auctions have been ugly lately, and weak demand could be a 'canary in the coal mine'
The drop in Treasury demand is concerning as dealer capacity to backstop auctions is lower due to limited balance sheet space, TD Securities warned.finance.yahoo.com
Not a matter of if Fed returns to QE and free money low interest rates, but a matter of when. Without it the markets might be worth as little as 50% of present value. With it the markets can maybe keep the bubble going and inflation eventually ramps up again to concerning levels. Rock meet hard place.
The massive government spending requires issuing large amounts of debt that not enough will buy at low rates. As bonds rates go, cost of borrowing goes up, deficits and total debt goes up... keep rinsing and repeating. Higher interest rates leads to higher credit costs, less consumption, more delinquencies, less corporate profits, more reason to be out of stocks and into bonds.
Pretty much what you are betting on long in the market is the Fed will cut interest rates and begin QE before debt swallows us whole, and prop the system a bit longer while inflation builds again.
It's not a bad bet to be long in the market because government has no fiscal responsibility and monetizing the debt is the politically easiest way to default on the debt, but make no mistake, it is a default and it will be a huge inflation tax.
Yup, rock <---> hard place.
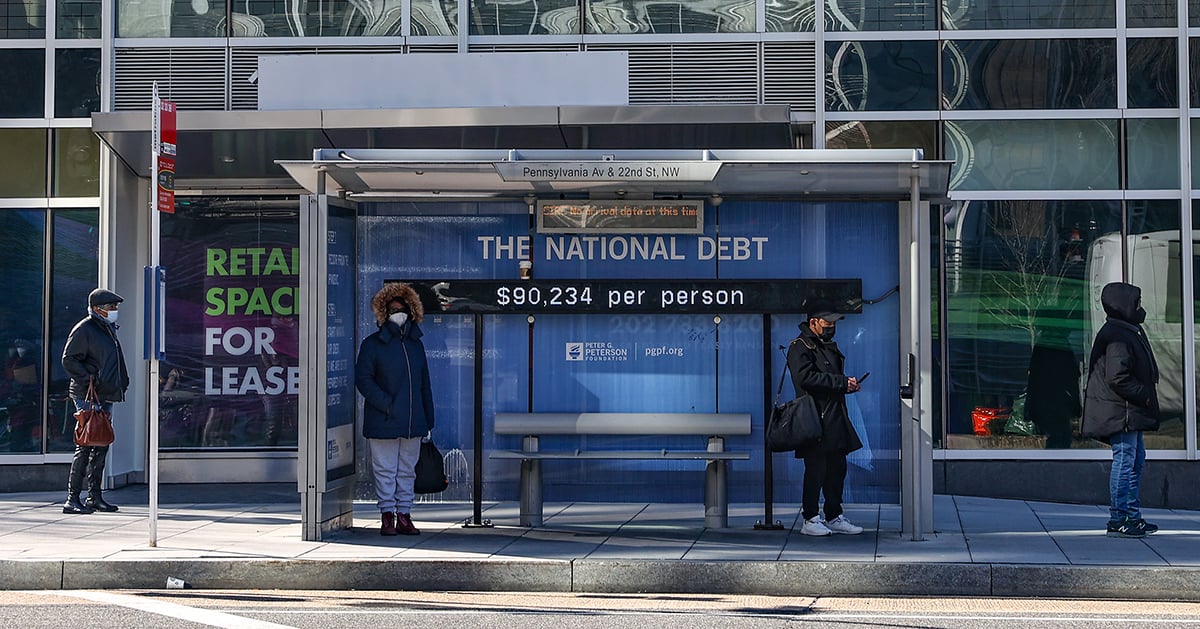
 www.pgpf.org
 www.forbes.com
 dailyhodl.com
well thats why we all waiting for that recession. but takes a while. so far earnings have been pretty good. jpm crushed it. stocks sky high.
but to make good returns, have to be selective on stocks. or just do bonds and make the 5%
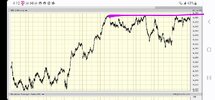
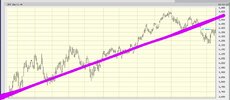
What we have here is a serious inflection point for the next big move, up or down we shall see. The one year upward trendline broke down hard and gapped down on Powell Fed Day a few weeks ago. It is no random coincidence chart disbelievers that the stock has been retesting that breakdown point repeatedly for about a week now. Surprising to me it is that in all those retests it came close but never quite filled the gap to 4400.Stocks just go up. If there's a down day it's followed by a even bigger up day! Or week. Big tech is crushing the rest
What we have here is a serious inflection point for the next big move, up or down we shall see. The one year upward trendline broke down hard and gapped down on Powell Fed Day a few weeks ago. It is no random coincidence chart disbelievers that the stock has been retesting that breakdown point repeatedly for about a week now. Surprising to me it is that in all those retests it came close but never quite filled the gap to 4400.
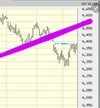
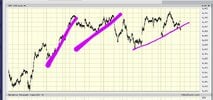
im a big chart fan bc its looked at by many people and decisions are made from it. stock movements have psychological component to it and this is just behavioralDon’t know anything about charts but why not draw the lines like this? How do you decide how far to look back?
View attachment 377797View attachment 377798
stock movements have psychological component to it and this is just behavioral
You answered your own question:Don’t know anything about charts but why not draw the lines like this? How do you decide how far to look back?
View attachment 377797View attachment 377798
You answered your own question:
You don't know anything.
Definitely a doctor though,
" I got through med school!!
If I don't understand it then it can't exist!"
That would be incorrect. Chart patterns form organically from people being sheep and the same market behavior and psychology of fear and greed repeats over and over. Old charts from 20+ years ago are much cleaner and neater. Today's are dirtier with far more fake outs for the exact reason you state, everyone is now a trading "genius" with 24/7 access; and no longer trading their natural tendency but rather outguessing the market with what they think it will do based on what they think they see. That has created charts today that are much more difficult to read than when they first jumped out at me 25 years without having any prior knowledge of what to even look for. I'm not so sure it would jump off the page at me if I just started looking at charts today.Spot on. If enough other investors use the same strategy as you, the investment strategy becomes valid. Thus people have had success using charts, being a boglehead and in crypto.
Looks like that spike yesterday to 4393 might be close enough to a gap fill and exhaustion. If so could be a nice ride down.im a big chart fan bc its looked at by many people and decisions are made from it. stock movements have psychological component to it and this is just behavioral
both of your green lines are valid. depends on how macro you want to look and also depends on what you talking about. first chart is a resistance line but your trend line is valid too.
I think it all depends on the Fed, when they stop doing the right thing and give in to the easier but wrong thing, like they did in 2008. The hole that we never dug out of then is now exponentially larger.Short term- weeks or days the market trades of charts and sentiment
Longer Term- Months to Years the market trades of earnings growth and fundamentals which includes macroeconomic factors
Many Investors have decided that the debt finally matters along with inflation. This is taking a toll on the economy longer term. I still think we get a recession in 2024 (early on) but then rally to new highs at some point in 2024.
Irony 👆That would be incorrect. Chart patterns form organically from people being sheep and the same market behavior and psychology of fear and greed repeats over and over. Old charts from 20+ years ago are much cleaner and neater. Today's are dirtier with far more fake outs for the exact reason you state, everyone is now a trading "genius" with 24/7 access; and no longer trading their natural tendency but rather outguessing the market with what they think it will do based on what they think they see. That has created charts today that are much more difficult to read than when they first jumped out at me 25 years without having any prior knowledge of what to even look for. I'm not so sure it would jump off the page at me if I just started looking at charts today.
You might need a dictionaryIrony 👆
Don't underestimate falling off that third retest trendline this morning. Keep an eye on it. The longer it stays broken the more likely we're going south.Looks like that spike yesterday to 4393 might be close enough to a gap fill and exhaustion. If so could be a nice ride down.
Don't underestimate falling off that third retest trendline this morning. Keep an eye on it. The longer it stays broken the more likely we're going south.
You answered your own question:
You don't know anything.
Definitely a doctor though,
" I got through med school!!
If I don't understand it then it can't exist!" 😂
What's interesting is the same patterns that exist long range exist on other levels right down to day charts day traders use. The longer more established trends trump the shorter trends... of course until they don't haha.Not exactly what I said but how do you decide how far to look back on the X-axis of these charts? That’s a sincere question.
we're up 12% YTD still..Looking like the wheels have gone off the rails