sadly if you DCA'd the first of the month, you'd only be up 3%we're up 12% YTD still..
You are using an out of date browser. It may not display this or other websites correctly.
You should upgrade or use an alternative browser.
You should upgrade or use an alternative browser.
Stock, the economy and the Fed for 2023
- Thread starter BLADEMDA
- Start date

- Joined
- Jun 7, 2019
- Messages
- 1,021
- Reaction score
- 1,114
Yes, but don't shoot the messenger; in my non-professional advice non-soliciting opinion... I don't see bottom around the corner. Day one of being chucked out the window to me looks like yesterday. I guess we'll see if it has legs or not.we're up 12% YTD still..
Last edited:
- Joined
- Dec 7, 2012
- Messages
- 541
- Reaction score
- 614
Any thoughts on Fibronacci retracements? At first consideration years ago, seemed like hocus pocus to me. Then, i warmed to the idea that they become self-fulfilling if enough people use them. Now, the older, more seasoned me has seen enough that i can't explain to entertain the possibility that there is some underlying mathematical order to this universe that I am unfamiliar with.What's interesting is the same patterns that exist long range exist on other levels right down to day charts day traders use. The longer more established trends trump the shorter trends... of course until they don't haha.
They say, "The trend is your friend."
I add, "until it ends."
Charts are another tool like a CBC and CXR. They don't tell you everything but are helpful in the whole picture. For me it's math porn. Fascinates me, even if only looking backwards, how the movements move so magically repetitively. I'm like, how in f--- did it know to do that.
What say...is it a thing, or are Fibronacci lines the Kardashians of trading?
- Joined
- May 15, 2005
- Messages
- 1,529
- Reaction score
- 1,748
These bold predictions have never been wrong before…Yes, but don't shoot the messenger; in my non-professional advice non-soliciting opinion... I don't see bottom around the corner. Day one of being chucked out the window to me looks like yesterday. I guess we'll see if it has legs or not.
- Joined
- Oct 26, 2008
- Messages
- 7,465
- Reaction score
- 4,144
it gets looked at. use all the data you can get, not just 1. there are absolutely patterns in stocks, due to whatever reason, human behavior/psychology or whatever. tons of stat/math phds go to hedge funds to make big bucks off these patternsAny thoughts on Fibronacci retracements? At first consideration years ago, seemed like hocus pocus to me. Then, i warmed to the idea that they become self-fulfilling if enough people use them. Now, the older, more seasoned me has seen enough that i can't explain to entertain the possibility that there is some underlying mathematical order to this universe that I am unfamiliar with.
What say...is it a thing, or are Fibronacci lines the Kardashians of trading?
Last edited:
- Joined
- Sep 4, 2009
- Messages
- 1,069
- Reaction score
- 763
Hedge funds make big money convincing us dopes they “see the patterns”. That, and insider trading and Ponzi schemes.i think it will get rocky .
it gets looked at. use all the data you can get, not just 1. there are absolutely patterns in stocks, due to whatever reason, human behavior/psychology or whatever. tons of stat/math phds go to hedge funds to make big bucks off these patterns
- Joined
- Oct 26, 2008
- Messages
- 7,465
- Reaction score
- 4,144
historically end of the year rises. this year, there are definitely head winds. mostly interest rate, with some geopolitical risk if the war blows up into larger regional war.
stocks are very sensitive to rates. we are seeing 8% mortgage on 30 year, and 10 year treasury approaching 5%. willl people dump loads of money into stocks if they can just get almost risk free 5% in bank account or treasuries?
also in the past 15 years or so, a large portion of stock skyrocket is due to corporate buybacks. as earnings drop, cost to borrow go up, there'll be less money to buyback.
but i like that its getting interesting
- Joined
- Jul 13, 2020
- Messages
- 336
- Reaction score
- 406
Yeah. It’s the Kobayashi Maru for us, but they cheat.Hedge funds make big money convincing us dopes they “see the patterns”. That, and insider trading and Ponzi schemes.
- Joined
- Jun 7, 2019
- Messages
- 1,021
- Reaction score
- 1,114
All predictions can be wrong. It's probability. I'm my opinion looking at everything it looks like selling pressure is going to be overwhelming for a while, particularly the way it squashed any boost after Powell spoke. If you want a guarantee buy a toaster.These bold predictions have never been wrong before…
I sold out 100% a few weeks ago first time ever. Nothing, nada, zero. So I believe what I'm saying but not stupid enough to guarantee it. If I'm wrong I'm not insecure enough to gaf that people will remind me I was wrong. I know I had valid reasons so who cares?
Last edited:
- Joined
- Jun 7, 2019
- Messages
- 1,021
- Reaction score
- 1,114
Exactly. It is DEFINITELY not the self fulfilling option. Typical doctors with typically 120 IQs argue with all their heart that charts are all voodoo, so what's the possibility the masses of average people could all work in unison to create this something that incredibly complex that a world of Elon Musk couldn't intentionally create? Zero. Positively zero chance. They are the exact reason I explained earlier that charts are much dirtier and more difficult to interpret.Any thoughts on Fibronacci retracements? At first consideration years ago, seemed like hocus pocus to me. Then, i warmed to the idea that they become self-fulfilling if enough people use them. Now, the older, more seasoned me has seen enough that i can't explain to entertain the possibility that there is some underlying mathematical order to this universe that I am unfamiliar with.
What say...is it a thing, or are Fibronacci lines the Kardashians of trading?
It is truly some sort of mathematical order based on the sheep-like behavior of humans, but how it can line up so perfectly I just can't explain. For everyone that adds nothing but ignorant attacking comments, I'm not saying charts can perfectly predict, though they often do help, but you look at them, the exactness of the lines that when they fall off trend the often rush to close on the line or gap the next day perfectly to the trendline. It is universe magic.
- Joined
- Jul 13, 2020
- Messages
- 336
- Reaction score
- 406
You are taking a cause and claiming that its direct effects blow your mind when they occur. Wow. Not surprising AT ALL.Exactly. It is DEFINITELY not the self fulfilling option. Typical doctors with typically 120 IQs argue with all their heart that charts are all voodoo, so what's the possibility the masses of average people could all work in unison to create this something that incredibly complex that a world of Elon Musk couldn't intentionally create? Zero. Positively zero chance. They are the exact reason I explained earlier that charts are much dirtier and more difficult to interpret.
It is truly some sort of mathematical order based on the sheep-like behavior of humans, but how it can line up so perfectly I just can't explain. For everyone that adds nothing but ignorant attacking comments, I'm not saying charts can perfectly predict, though they often do help, but you look at them, the exactness of the lines that when they fall off trend the often rush to close on the line or gap the next day perfectly to the trendline. It is universe magic.
- Joined
- Dec 5, 2005
- Messages
- 1,799
- Reaction score
- 3,111
+100 tribbles for the on point reference.Yeah. It’s the Kobayashi Maru for us, but they cheat.
- Joined
- Feb 24, 2022
- Messages
- 1,115
- Reaction score
- 4,446
Wrong analogy.+100 tribbles for the on point reference.
How not to play: 100% passive. Ultra low cost. Tax manage. That's it.
- Joined
- Jun 7, 2019
- Messages
- 1,021
- Reaction score
- 1,114
And what's the cause genius that has so far shown zero knowledge of anything?You are taking a cause and claiming that its direct effects blow your mind when they occur. Wow. Not surprising AT ALL.
- Joined
- Jun 7, 2019
- Messages
- 1,021
- Reaction score
- 1,114
I haven't delved much into fibronacci retracements but I figure there is some validity to it based on sheep-like repetition. I can occasionally find an old chart mirroring closely what's going on in a current stock or market and it's almost like a cheat code going forward for a while. It's crazy when you see that.Any thoughts on Fibronacci retracements? At first consideration years ago, seemed like hocus pocus to me. Then, i warmed to the idea that they become self-fulfilling if enough people use them. Now, the older, more seasoned me has seen enough that i can't explain to entertain the possibility that there is some underlying mathematical order to this universe that I am unfamiliar with.
What say...is it a thing, or are Fibronacci lines the Kardashians of trading?
- Joined
- Jul 13, 2020
- Messages
- 336
- Reaction score
- 406
Okay. Make specific claims. Quote the stocks. Put the dates that you buy and sell. We can judge actual results not your throwing out terminology that doesn’t translate into beating the market. Unless you can actually beat the market, you are just treating sdn as your personal blog to hear yourself talk.I haven't delved much into fibronacci retracements but I figure there is some validity to it based on sheep-like repetition. I can occasionally find an old chart mirroring closely what's going on in a current stock or market and it's almost like a cheat code going forward for a while. It's crazy when you see that.
- Joined
- Jun 7, 2019
- Messages
- 1,021
- Reaction score
- 1,114
Yeah I'll do that, cause I care about winning over a big baby all insecure and angry when he doesn't understand something.Okay. Make specific claims. Quote the stocks. Put the dates that you buy and sell. We can judge actual results not your throwing out terminology that doesn’t translate into beating the market. Unless you can actually beat the market, you are just treating sdn as your personal blog to hear yourself talk.
🙄🙄🙄
Grow up Charlie Brown.
You might actually learn something.
- Joined
- Jun 7, 2019
- Messages
- 1,021
- Reaction score
- 1,114
Your investment plan isn't working:Okay. Make specific claims. Quote the stocks. Put the dates that you buy and sell. We can judge actual results not your throwing out terminology that doesn’t translate into beating the market. Unless you can actually beat the market, you are just treating sdn as your personal blog to hear yourself talk.
🤣🤣🤣
Attachments

- Joined
- Jun 7, 2019
- Messages
- 1,021
- Reaction score
- 1,114
Not that it would matter Mr Anger Management because you've learned literally nothing from what I've posted, add nothing, can't point out any incorrect statements, and bore the bleep out of me with the constant unprovoked attacks, harassment, and stalking, but here:Okay. Make specific claims. Quote the stocks. Put the dates that you buy and sell. We can judge actual results not your throwing out terminology that doesn’t translate into beating the market. Unless you can actually beat the market, you are just treating sdn as your personal blog to hear yourself talk.
Few days before Fed Powell drop over a month ago
"Sold everything."
Are we happy now?
I get it, you don't have a math brain and chart talk upsets you, but go away, have a cream soda, make a ham sandwich, just do something else other than bother me.
- Joined
- Jun 7, 2019
- Messages
- 1,021
- Reaction score
- 1,114
Here's another call for you in print:Okay. Make specific claims. Quote the stocks. Put the dates that you buy and sell. We can judge actual results not your throwing out terminology that doesn’t translate into beating the market. Unless you can actually beat the market, you are just treating sdn as your personal blog to hear yourself talk.
Throw a dart, hit something, and short it.
It will do better than your account.
- Joined
- Jun 7, 2019
- Messages
- 1,021
- Reaction score
- 1,114
Everyone here knows I own a good portion of gold. Hasn't done much, up and down past year or two. Still near all time highs. Are we happy and smiling now?Okay. Make specific claims. Quote the stocks. Put the dates that you buy and sell. We can judge actual results not your throwing out terminology that doesn’t translate into beating the market. Unless you can actually beat the market, you are just treating sdn as your personal blog to hear yourself talk.
What do own genius other than the need to harass people that want nothing to do with you with 4 year old level blah blah blah and fantasies of whatever you do with those eggplants.
Trigger Investments:
Attachments

- Joined
- Jul 13, 2020
- Messages
- 336
- Reaction score
- 406
Okay. Let us know when you re-invest.Not that it would matter Mr Anger Management because you've learned literally nothing from what I've posted, add nothing, can't point out any incorrect statements, and bore the bleep out of me with the constant unprovoked attacks, harassment, and stalking, but here:
Few days before Fed Powell drop over a month ago
"Sold everything."
Are we happy now?
I get it, you don't have a math brain and chart talk upsets you, but go away, have a cream soda, make a ham sandwich, just do something else other than bother me.
My accounts are mostly spread out across several mutual funds- small cap, mid cap, S&P, Blue Chip, some international.
You spend a lot of time talking nonsense about charts but I bet you don’t get a better return than me and you definitely have higher risk. If you luck out and have a good year, you won’t be able to reproduce it long term.
I don’t care what you have to say, but I hope no young folks reading your drivel think they should start day trading. It’s foolish and bad advice.
Last edited:
- Joined
- Jun 7, 2019
- Messages
- 1,021
- Reaction score
- 1,114
I think a 4225/4230 retest is a given at this point. I also believe it won't hold this time.
High Vix. Should be a lot of action.
High Vix. Should be a lot of action.
- Joined
- Apr 22, 2007
- Messages
- 22,315
- Reaction score
- 8,964
Correct. It's almost impossible to time both getting "in" and getting "out." You must keep the majority of your money invested at all times and weather the storms. Now, you can play with up to 20% by "guessing" about direction and sentiment. I agree that sentiment is very negative and a rally into year end is unlikely. That said, we could still end the year at 4350.Okay. Let us know when you re-invest.
My accounts are mostly spread out across several mutual funds- small cap, mid cap, S&P, Blue Chip, some international.
You spend a lot of time talking nonsense about charts but I bet you don’t get a better return than me and you definitely have higher risk. If you luck out and have a good year, you won’t be able to reproduce it long term.
I don’t care what you have to say, but I hope no young folks reading your drivel think they should start day trading. It’s foolish and bad advice.
My biggest concern is the huge deficit because of the need to issue huge amounts of bonds top pay for it. That's why long term rates are going up. The market wants higher returns to hold US debt and even then there aren't enough buyers. The 10 year could hit 5.5% or even 6% as investors demand more to hold US debt longer term. Typically, stocks don't do well with 10 year bonds at 5.5% or higher.
10-year Treasury yield rises to 5%, the highest level for the key rate in 16 years
The 10-year Treasury yield rose on Thursday hitting a 16-year high as investors pored over remarks from Federal Reserve Chairman Jerome Powell.
- Joined
- Jun 7, 2019
- Messages
- 1,021
- Reaction score
- 1,114
I find getting in the more difficult point. Spotting something like getting out of the dot com bubble or 08 collapse, you can spot it if you're paying attention. After a steep drop, almost seems like, well this feels a good place to be a buyer. Just have to take a stab what looks like a good support level, though likely you don't hit it.Correct. It's almost impossible to time both getting "in" and getting "out." You must keep the majority of your money invested at all times and weather the storms. Now, you can play with up to 20% by "guessing" about direction and sentiment. I agree that sentiment is very negative and a rally into year end is unlikely. That said, we could still end the year at 4350.
My biggest concern is the huge deficit because of the need to issue huge amounts of bonds top pay for it. That's why long term rates are going up. The market wants higher returns to hold US debt and even then there aren't enough buyers. The 10 year could hit 5.5% or even 6% as investors demand more to hold US debt longer term. Typically, stocks don't do well with 10 year bonds at 5.5% or higher.
10-year Treasury yield rises to 5%, the highest level for the key rate in 16 years
The 10-year Treasury yield rose on Thursday hitting a 16-year high as investors pored over remarks from Federal Reserve Chairman Jerome Powell.www.cnbc.com
- Joined
- May 15, 2005
- Messages
- 1,529
- Reaction score
- 1,748
So tell us the day the market hits bottom..k, thx.
- Joined
- Feb 24, 2022
- Messages
- 1,115
- Reaction score
- 4,446
So tell us the day the market hits bottom..k, thx.
June 1932.
- Joined
- Jun 7, 2019
- Messages
- 1,021
- Reaction score
- 1,114
You once told me don't get emotional about stock, Gordon.Blah blah blah
The bid is back at the 4230 support level.
What do you want to do? Decide.
- Joined
- Feb 24, 2022
- Messages
- 1,115
- Reaction score
- 4,446
You once told me don't get emotional about stock, Gordon.
The bid is back at the 4230 support level.
What do you want to do? Decide.
- Joined
- Jun 7, 2019
- Messages
- 1,021
- Reaction score
- 1,114
GREAT MOVIE!!
That and Trading Places, classic movies about the markets.
- Joined
- Feb 24, 2022
- Messages
- 1,115
- Reaction score
- 4,446
the big short was probably the one that was closest to reality. I also liked margin call.GREAT MOVIE!!
That and Trading Places, classic movies about the markets.
Special place in my heart for Wolf of Wall street
- Joined
- Jul 13, 2020
- Messages
- 336
- Reaction score
- 406
Madoff: The Monster of Wall Street.the big short was probably the one that was closest to reality. I also liked margin call.
Special place in my heart for Wolf of Wall street
- Joined
- Jun 7, 2019
- Messages
- 1,021
- Reaction score
- 1,114
Haven't watched the first two yet.the big short was probably the one that was closest to reality. I also liked margin call.
Special place in my heart for Wolf of Wall street
Will start on it this weekend!
- Joined
- Jun 7, 2019
- Messages
- 1,021
- Reaction score
- 1,114
Mini-Madoff SBFMadoff: The Monster of Wall Street.
Lock him up!
- Joined
- Oct 26, 2008
- Messages
- 7,465
- Reaction score
- 4,144
what software do you use for your trading?Mini-Madoff SBF
Lock him up!
- Joined
- Jun 7, 2019
- Messages
- 1,021
- Reaction score
- 1,114
I'm not really an "active" trader. The compulsive overtrading me was more like late nineties where I'd see one really good trade and then make another 20 unnecessary trades to get my fix followed by giving back anything I might have been up plus a little more.what software do you use for your trading?
Now I'm more just ocd fine tuning stuff occasionally and spotting a short term trade idea or two, typically looking out weeks instead of minutes. Sometimes I'll get over it all and go months and years without looking. So basically all I need is the tdameritrade app for trading.
The charting is what I'm into. I have the desktop thinkorswim for extensive charting and professional computer drawing of lines, and the "big charts" website I use on my phone to look at their 10 day by one minute charts. I find that 10 day chart so useful to identify the exact trendline. That's what the scribbled on charts are I occasionally post.
I usually don't believe in much technical analysis gizmos but I've come to learn, check the RSI before a big move. No idea how it's derived, don't care, but have lost too many times to count because I bet against it, ie says overbought and I buy, says oversold and I've sold.
Edit on the RSI: Much more reliable in everyday low vix (volatility) environment. In complete panic mode (high vix) a low RSI (oversold) should be taken with caution (ie skepticism).
Oh yeah, never use a chart not in log form.
Last edited:
- Joined
- Apr 5, 2005
- Messages
- 1,507
- Reaction score
- 337
Margin Call was very good on several levels, but got little publicity. A real shame in my opinion.the big short was probably the one that was closest to reality. I also liked margin call.
Special place in my heart for Wolf of Wall street
- Joined
- Jun 7, 2019
- Messages
- 1,021
- Reaction score
- 1,114
Well that didn't take long. With a strong support level and so much going on and tons of earnings this week it could be very choppy before giving way... or completely surrender without a fight. But my personal non-professional read is still the conclusion will be 4230ish (4225 whatever) has as much chance of stopping the sell off as stopping a semi with a pile of soft butter and pillows. (I'm sure everybody will remind me if that's incorrect hahaha)I think a 4225/4230 retest is a given at this point. I also believe it won't hold this time.
High Vix. Should be a lot of action.
- Joined
- Jun 7, 2019
- Messages
- 1,021
- Reaction score
- 1,114
I love Powell so far. But will he stay tough? All government behind us the past 40 years and all previous Fed people since Volker have created a massive bloated propped up bubble. People now want a quick fix for all of the debt and inflation. Guess what, there is none. Never will be. You pay the piper now, or you pay him more later. You da man Powell.... (if you don't cave to pressure)*.
 www.barrons.com
Powell: U.S.'s Fiscal Path Is ‘Unsustainable’
The overall level of the U.S.’s debt isn’t a problem in itself, the Federal Reserve’s Jerome Powell said Thursday. But when asked about the level of government borrowing relative to the past, the chairman suggested that rapidly rising debt levels could become a problem moving forward. “The path we'
www.barrons.com
- Joined
- Jun 7, 2019
- Messages
- 1,021
- Reaction score
- 1,114
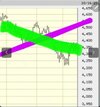
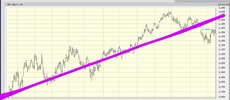
Ok, my bad and apology for the response to you. Looking back it appears now you were actually asking a serious question 😂. I thought it was another mocking comment on here in the endless stream of it and thought you were just smudging through the whole thing. But now I see there are real questions in your post.Don’t know anything about charts but why not draw the lines like this? How do you decide how far to look back?
View attachment 377797View attachment 377798
The image attached where you ask "why not the green direction" is because it's a blow up of just one section of the much larger image (also attached). The purple line is the one year trendline, and the blown up version was to zoom in on what I feel is the critical break in it.
You are absolutely correct in that there's uptrends and downtrends frequently on the same chart. The purple line is the longer term uptrend. The green is part of the shorter downtrend. A downtrend can be completely embedded in the uptrend, such as when they say "buy the dip" when it has a long steady uptrend but a short downtrend buying opportunity (the dip).
How far back to look, actually it all matters to attempt to get a complete picture. So let's say before the chart starting breaking down you say, look we're in a downtrend (green), but someone might say the one year trend up is still intact, but someone else might say but looking a few years back the Jan/22 and Aug/23 peaks look like a suspicious double top, and then another adds looking at the over 100 year up channel (which is a really cool chart) you can draw a straight line through the peaks of 1929, 2000, and 2022 forming the upper channel line, and if those years don't grab your attention to be cautious nothing will. So basically it's all important, and day traders which I recommend nobody ever do, zoom in much much closer than any of these charts, because incredibly the same principles hold true looking at a day chart or a 100 year chart.
(yeah I admit I have way more knowledge of stock chart intricacies that any normal person should, but it's how I'm wired so it fascinates me)
Attachments
- Joined
- Feb 23, 2015
- Messages
- 228
- Reaction score
- 453
Just wanted to say that it’s true indicators can be self-fulfilling if enough people bother to pay attention to it… The problem? Many times various indicators conflict. For example, a lot of people pay attention to so-called “death crosses” where the 50 day average of a stock crosses the 200 day average… but people also pay attention to VIX. To RSI. To trend lines. To Fibonacci sequences. And they pay attention to the daily/weekly/monthly/yearly/3y/5y chart etc. To local news of the day regarding that stock. To local news of the day regarding the market. These things are often in conflict.
That said I’m not a purist. I have made money buying stocks I felt were absurdly undervalued due to negative sentiment (Facebook a year ago was trading for less than Home Depot… yeah, I know) but I treat it like a hobby. It’s fun, and it’s better odds than the casino at least.
Ultimately the nice thing about being in a high-earning field is that you don’t need to strike it rich with a fortunate stock pick to have a very nice life. 60k a year in 401k = ~6M after 30 years.
- Joined
- Oct 10, 2007
- Messages
- 4,253
- Reaction score
- 7,082
The way they tell it here that isn't enough to pay for your kids 15+ years of private education and 4x annual family vacation to Europe without ending up being homeless on the streets.Ultimately the nice thing about being in a high-earning field is that you don’t need to strike it rich with a fortunate stock pick to have a very nice life. 60k a year in 401k = ~6M after 30 years.
- Joined
- Jun 7, 2019
- Messages
- 1,021
- Reaction score
- 1,114
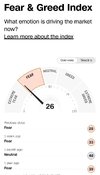
If you are a contrarian to extreme levels of fear and greed it typically plays in your favor. And even having had my behind handed to me in the past for not being contrarian to it... I still can't get off the fear train and go long haha
Attachments
- Joined
- Jan 14, 2006
- Messages
- 11,882
- Reaction score
- 20,915
So last week was the best week all year (4117–>4358). Any predictions into year end?
- Joined
- Dec 15, 2005
- Messages
- 15,392
- Reaction score
- 21,622
I predict a continuation of nobody knowin' nothing.So last week was the best week all year (4117–>4358). Any predictions into year end?
- Joined
- Feb 18, 2016
- Messages
- 145
- Reaction score
- 322
I predict an inverse correlation between the height of the SP500 and the frequency of bear posts.
- Joined
- Apr 22, 2007
- Messages
- 22,315
- Reaction score
- 8,964
I've posted this before but I will say it again. Dollar cost averaging is the right thing to do for most people. It takes the emotion out of investing long term.
You set your model like 80/20 or 90/10 then stay at it. For those that want to be more active investors another approach is to dollar cost average 80% and set aside 20% for market dips or bear markets. This means you put that money to work on really bad weeks or bear markets. But, you must hold your nose and actually invest the money. You decide what level to invest the remaining 20% of cash like 6% or 8% pullbacks. If at the end of the year you haven't invested the cash then this strategy isn't a good one for you.
Over the decades I have purchased a lot of blue chip stocks which have done well. I stay away from mid cap and small cap companies by buying ETFs.
My worst investments have been Chinese stocks and bank stocks. They are good for short term trades but have been terrible long term investments. I no longer buy any Chinese stocks or ETFs even if they are "cheap."
What does 2024 look like for stocks? I have no idea but I do know if you don't stay invested you will likely not do well longer term. Timing the market is almost impossible so develop a strategy which works over decades not weeks.
- Joined
- Jan 14, 2006
- Messages
- 11,882
- Reaction score
- 20,915
I've posted this before but I will say it again. Dollar cost averaging is the right thing to do for most people. It takes the emotion out of investing long term.
You set your model like 80/20 or 90/10 then stay at it. For those that want to be more active investors another approach is to dollar cost average 80% and set aside 20% for market dips or bear markets. This means you put that money to work on really bad weeks or bear markets. But, you must hold your nose and actually invest the money. You decide what level to invest the remaining 20% of cash like 6% or 8% pullbacks. If at the end of the year you haven't invested the cash then this strategy isn't a good one for you.
Over the decades I have purchased a lot of blue chip stocks which have done well. I stay away from mid cap and small cap companies by buying ETFs.
My worst investments have been Chinese stocks and bank stocks. They are good for short term trades but have been terrible long term investments. I no longer buy any Chinese stocks or ETFs even if they are "cheap."
What does 2024 look like for stocks? I have no idea but I do know if you don't stay invested you will likely not do well longer term. Timing the market is almost impossible so develop a strategy which works over decades not weeks.
Only problem with DCAing every month is that it is old and boring and we can’t post about it endlessly
")
- Joined
- Jan 14, 2006
- Messages
- 11,882
- Reaction score
- 20,915
So last week was the best week all year (4117–>4358). Any predictions into year end?
S&P now 4600
- Joined
- Apr 22, 2007
- Messages
- 22,315
- Reaction score
- 8,964
My prediction is we get a 5-7% pullback in January or February. This is in anticipation of the "soft landing" or mild recession in 2024. I recommend you don't panic, stay invested and buy the pullback. If you don't own any bonds 2024 is a great time to buy a bond fund or bond ETF vs holding cash in a money market. I only predict 1-2 rate cuts next year but that still bodes well for bonds.S&P now 4600