- Joined
- May 26, 2010
- Messages
- 736
- Reaction score
- 39
Quick update, I had one piece of incorrect info in there, and it's now fixed. The spreadsheet is now as accurate as possible.
Update: 2/9/12
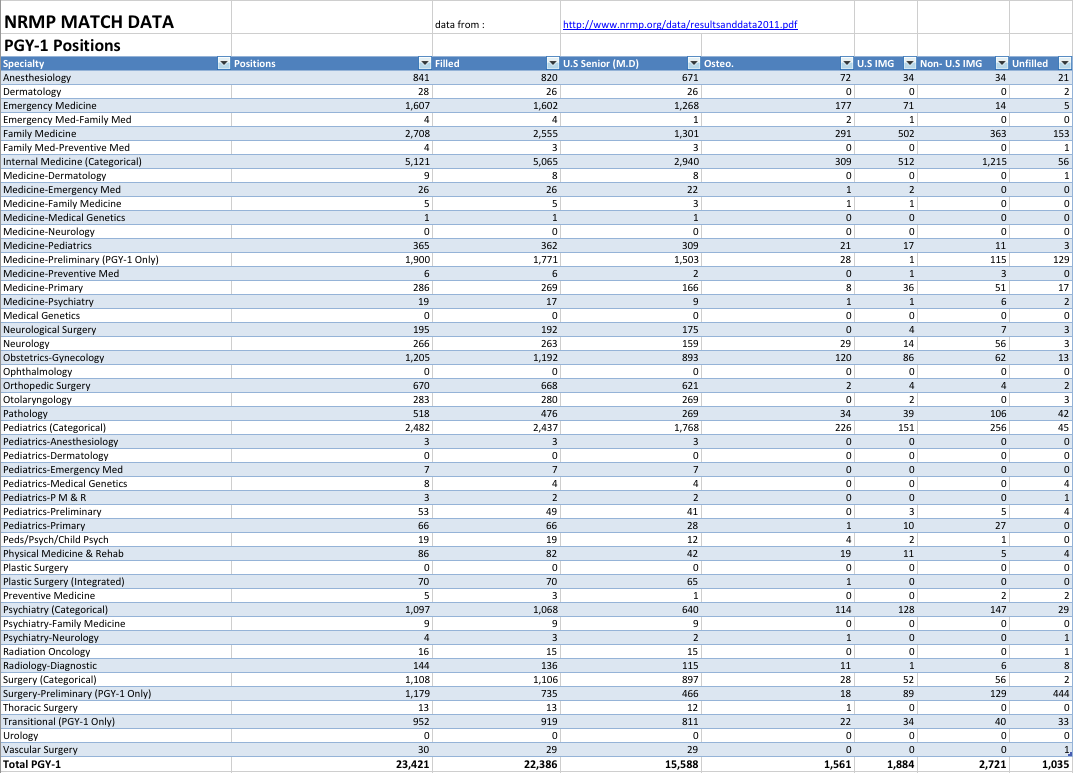
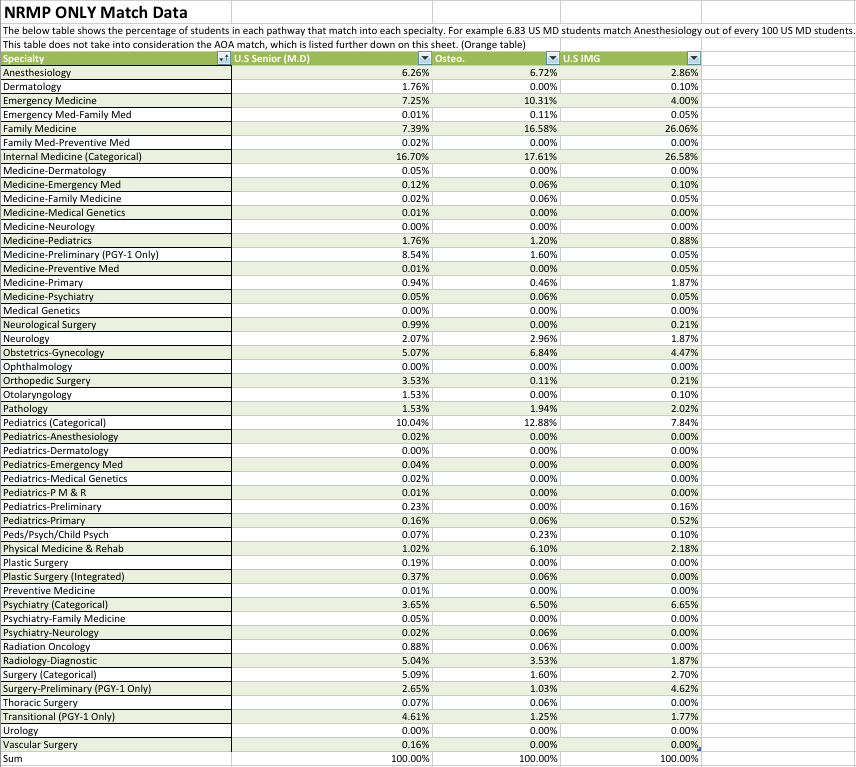
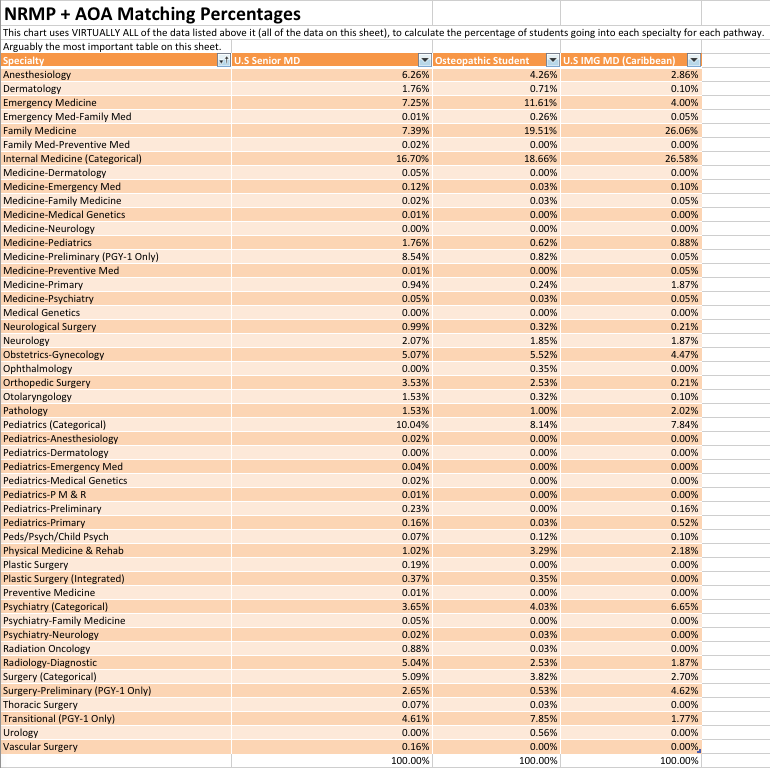
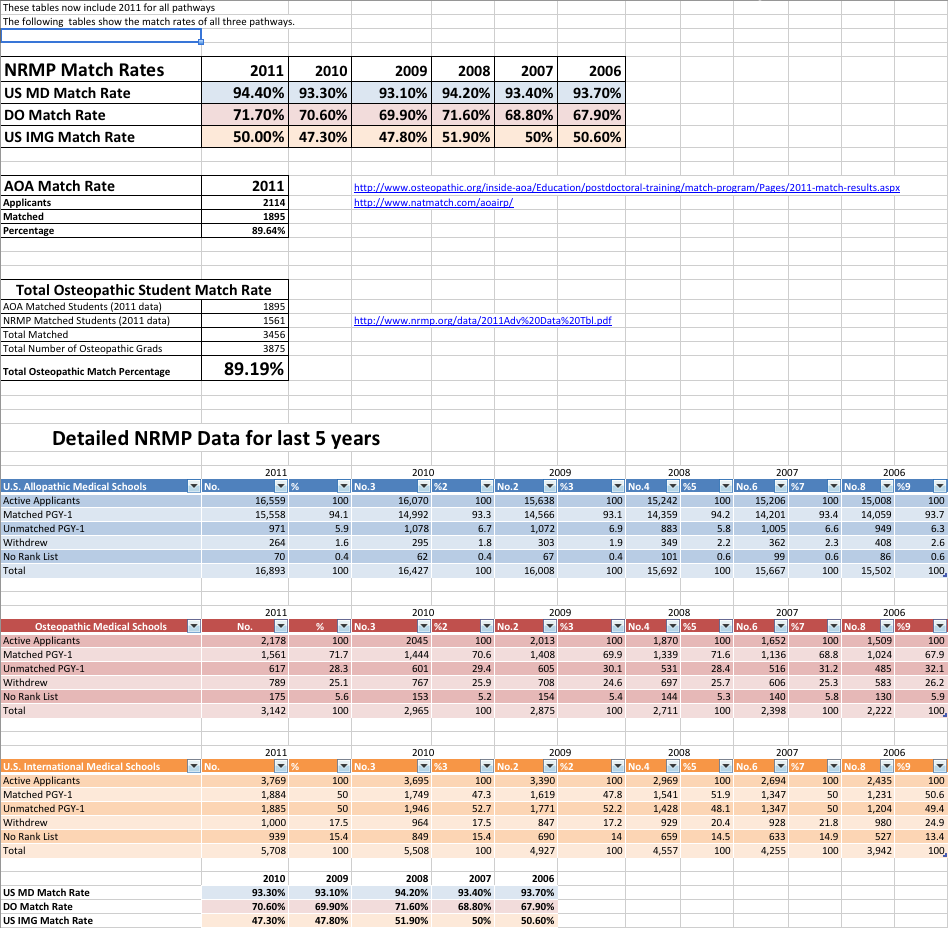
I've updated the spreadsheet to include 2011 NRMP data from the 2010 data. Make sure you look at the Green and Orange chart specifically, they're the most important.
Feel free to comment with any questions. I hope this shows that DO's are more equally represented then some people would lead you to believe.
I've left the previous spreadsheet attached for anyone who is interested in comparing. The newest spreadsheet is titled
"HockeyDr's Massive Spreadsheet with 2011 NMRP Data final.xlsx"
----------------------------------------------------------------------------------------------------------------
I know, I know, you've heard it all before.
This thread is different.
For this thread, I'm only concerned about factual evidence. I'm not interested in hearsay / anecdotal evidence, and honestly if you're deciding between pathways, you shouldn't care about it either.
I've compiled all the data you could possible imagine comparing the three pathways to become a licensed physician.
Most everything you'd ever want to know about comparing the three is listed in the three page spread sheet I have attached.
I show statistics (and cite) data for
I was objective as humanly possible and listed my concerns about where there could be errors in the data on page 1 of the spread sheet.
My concerns (edit: old)
I was forced to use 2010 NRMP data and 2011 AOA data. Ultimately this shouldn't make too much of a difference because most of the AOA's competitive specialties were filled both years, so the 2010 AOA data shouldn't vary dramatically.
I could not add match list rankings (which students were getting their first choice). I also could not account for one residency location being more competitive than others. My point being, even though DO's matched a very similar percentage to MD in internal medicine, most people would assume that MD's had first pick at the very competitive locations. This should be taken into consideration.
There is always a possibility of some of the data being miscalculated. Excel likes to screw with me sometimes.
This DOES NOT INCLUDE PRE-MATCH AND SCRAMBLE MATCHES!!
Very important: I also could not list the attrition rates because it was simply too much data scattered in different locations. You'll have to do your research for that.
Also note the the Urology MD match does not use the NRMP, so this lowers their percentages. If I find it, i'll add it.
Odds are this thread will either be buried, or turn into a flame war, but I wanted to at least put all of the statistics out there in one place, organized.
If we keep it civil it could possibly be the thread to end all MD vs DO vs Carib threads (wishful thinking).
The great thing about the statistics is that you can draw your own conclusions. Nervous about matching EM as a DO? Pop open the sheet and you see 373 DO's matched EM (PGY-1) and that 12% of graduating DO's match EM.
Hopefully someone gets a use out of it. It took me forever to make .
.
Edit:
If you don't want to dl the spreadsheet, dannydickman was kind enough to post screenshots of a majority of the data.
I haven't figured out how to incorporate the data yet but
SF match data
Ophthalmology
Child Neurology
Plastic Surgery
Neurotology
All other match data on their site is for fellowship positions.
Urology match stats
This data would increase MD matches in Urology and Ophthamology (MD Ophthamology is not included on spreadsheet because it was not included in the NRMP data). DO's and US IMG's seem to be included, but I can't figure out a way to discern which is which.
Update: 2/9/12
I've updated the spreadsheet to include 2011 NRMP data from the 2010 data. Make sure you look at the Green and Orange chart specifically, they're the most important.
Feel free to comment with any questions. I hope this shows that DO's are more equally represented then some people would lead you to believe.
I've left the previous spreadsheet attached for anyone who is interested in comparing. The newest spreadsheet is titled
"HockeyDr's Massive Spreadsheet with 2011 NMRP Data final.xlsx"
----------------------------------------------------------------------------------------------------------------
I know, I know, you've heard it all before.
This thread is different.
For this thread, I'm only concerned about factual evidence. I'm not interested in hearsay / anecdotal evidence, and honestly if you're deciding between pathways, you shouldn't care about it either.
I've compiled all the data you could possible imagine comparing the three pathways to become a licensed physician.
Most everything you'd ever want to know about comparing the three is listed in the three page spread sheet I have attached.
I show statistics (and cite) data for
- NRMP match data for every specialty for each pathway
- NRMP match percentage for each specialty. This shows what percentage of the total applicant pool for each pathway matched in which specialty (i.e did everyone from DO schools match FM)
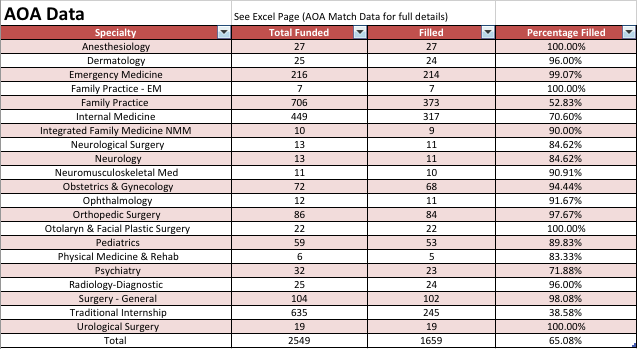
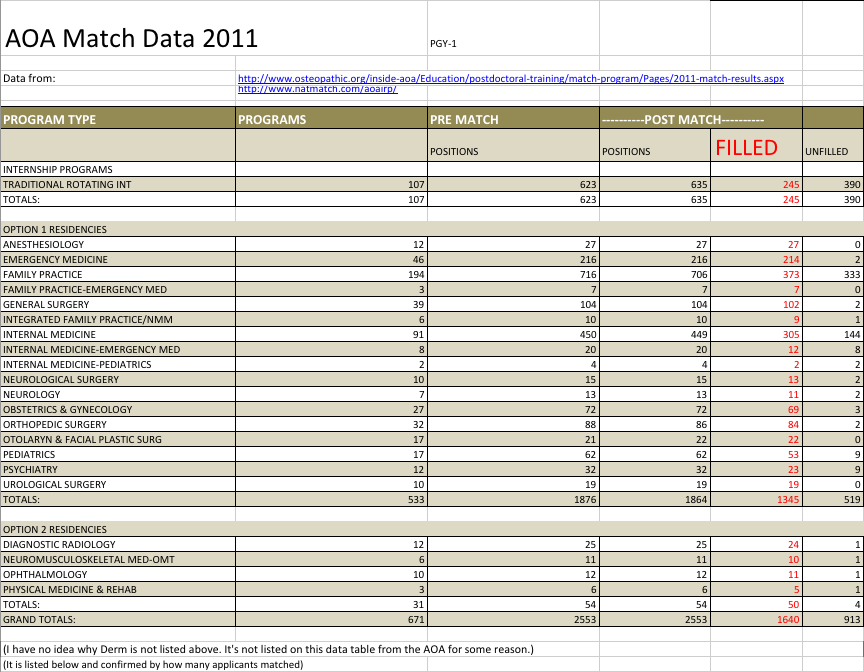
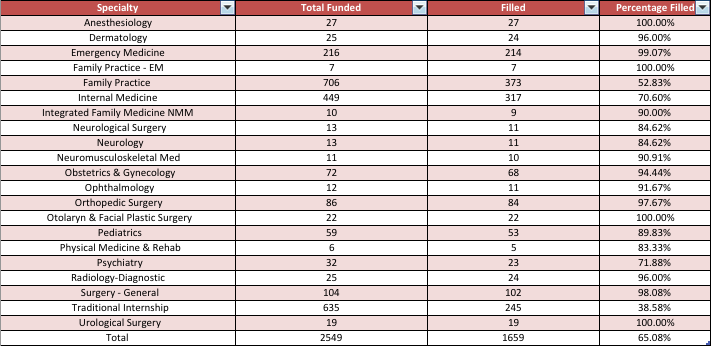
- AOA match data for every specialty
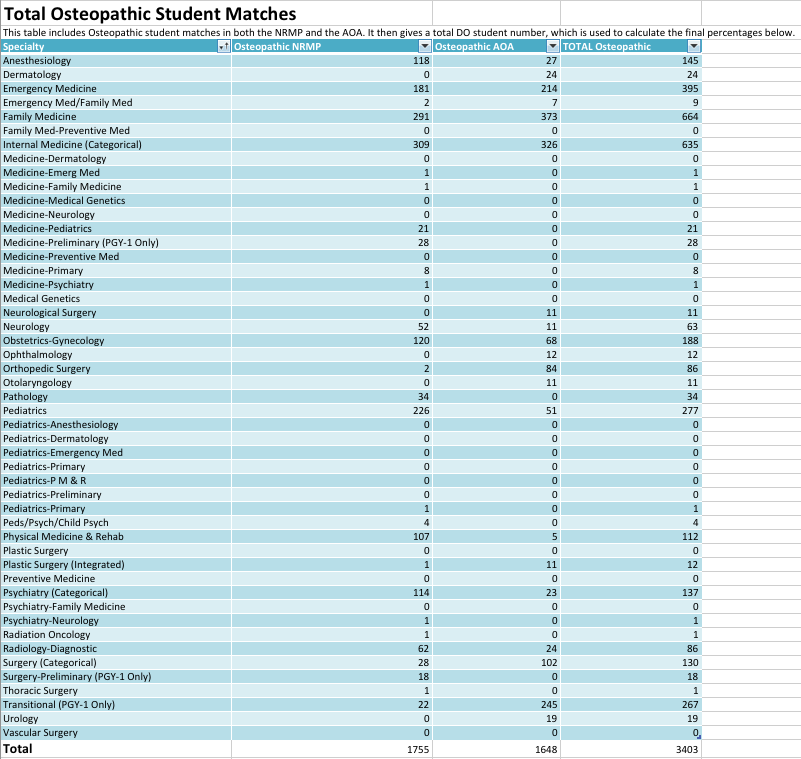
- Total DO student matches in each specialty NRMP + AOA
- Matching percentage for NRMP + AOA. What percentage of DO students matched into each specialty when looking at both NRMP and AOA combined
- Full 2011 AOA match list, organized in table format.
- An analysis of the NRMP match rates, and the calcuation of a true DO student match rate, taking into consideration both the NRMP and the AOA match.
- A comparasion between all the pathways match rates.
I was objective as humanly possible and listed my concerns about where there could be errors in the data on page 1 of the spread sheet.
My concerns (edit: old)
I was forced to use 2010 NRMP data and 2011 AOA data. Ultimately this shouldn't make too much of a difference because most of the AOA's competitive specialties were filled both years, so the 2010 AOA data shouldn't vary dramatically.
I could not add match list rankings (which students were getting their first choice). I also could not account for one residency location being more competitive than others. My point being, even though DO's matched a very similar percentage to MD in internal medicine, most people would assume that MD's had first pick at the very competitive locations. This should be taken into consideration.
There is always a possibility of some of the data being miscalculated. Excel likes to screw with me sometimes.
This DOES NOT INCLUDE PRE-MATCH AND SCRAMBLE MATCHES!!
Very important: I also could not list the attrition rates because it was simply too much data scattered in different locations. You'll have to do your research for that.
Also note the the Urology MD match does not use the NRMP, so this lowers their percentages. If I find it, i'll add it.
Odds are this thread will either be buried, or turn into a flame war, but I wanted to at least put all of the statistics out there in one place, organized.
If we keep it civil it could possibly be the thread to end all MD vs DO vs Carib threads (wishful thinking).
The great thing about the statistics is that you can draw your own conclusions. Nervous about matching EM as a DO? Pop open the sheet and you see 373 DO's matched EM (PGY-1) and that 12% of graduating DO's match EM.
Hopefully someone gets a use out of it. It took me forever to make
.Edit:
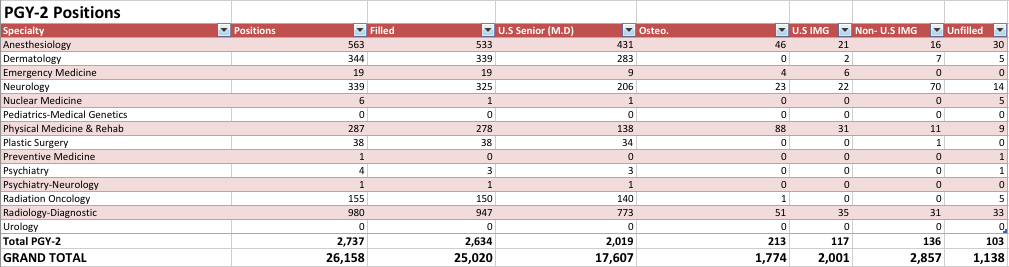
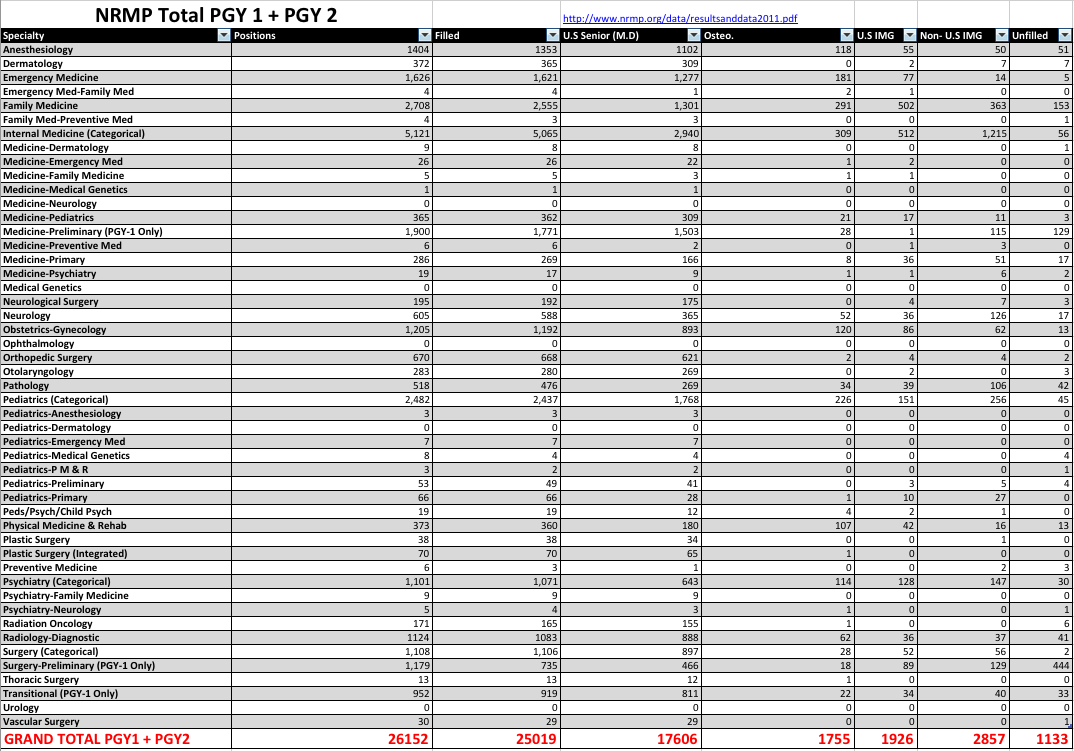
- The data has been UPDATED to include ALL PGY-1 and PGY-2 matches.
- It has additional tables on sheet one which incorporate PGY-1 and PGY-2
- Page 2 now includes every AOA detail I could find (cited)
- Page 3 now includes 2011 data for both AOA and NRMP matching rates.
If you don't want to dl the spreadsheet, dannydickman was kind enough to post screenshots of a majority of the data.
I haven't figured out how to incorporate the data yet but
SF match data
Ophthalmology
Child Neurology
Plastic Surgery
Neurotology
All other match data on their site is for fellowship positions.
Urology match stats
This data would increase MD matches in Urology and Ophthamology (MD Ophthamology is not included on spreadsheet because it was not included in the NRMP data). DO's and US IMG's seem to be included, but I can't figure out a way to discern which is which.
Attachments
Last edited: